Lakeland: Fire Incidents, Florida (FL)
Where are fire incidents reported in Lakeland, FL
Something went wrong! Please refresh the page.
| Fire incidents reported | |
|---|---|
| Sreet name | Count |
| FLORIDA AVE | 260 |
| 98 HWY | 240 |
| I4 | 234 |
| COMBEE RD | 210 |
| KATHLEEN RD | 190 |
| MAIN ST | 178 |
| MEMORIAL BLVD | 154 |
| ARIANA ST | 132 |
| REYNOLDS RD | 120 |
| 92 HWY | 116 |
| SOCRUM LOOP | 110 |
| LAKE PARKER DR | 108 |
| MEMORIAL BL | 108 |
| EDGEWOOD DR | 106 |
| CLEVELAND HTS | 104 |
| FLORIDA AV | 96 |
| BELLA VISTA ST | 94 |
| ROCKRIDGE RD | 94 |
| 14TH ST | 90 |
| MAINE AVE | 90 |
| 10TH ST | 88 |
| CRYSTAL GROVE DR | 88 |
| PARKER ST | 86 |
| LAKELAND HIGHLANDS RD | 80 |
| GRIFFIN RD | 78 |
| PIPKIN RD | 76 |
| OLD POLK CITY RD | 74 |
| PROVIDENCE RD | 74 |
| NEW TAMPA HWY | 68 |
| ORANGE ST | 66 |
| Other | 6,734 |
2004 - 2018 National Fire Incident Reporting System (NFIRS) incidents
- Incident types reported to NFIRS in Lakeland, FL
- 108,35968.1%Rescue & EMS
- 19,04912.0%Good Intent Call
- 11,1077.0%Service Call
- 10,3466.5%Fire
- 5,2593.3%False Alarm
- 4,8133.0%Hazardous Condition
- Fire incident types reported to NFIRS in Lakeland, FL
- 4,20540.6%Outside Fires
- 4,07339.4%Structure Fires
- 1,92818.6%Mobile Property/Vehicle Fires
- 1401.4%Other
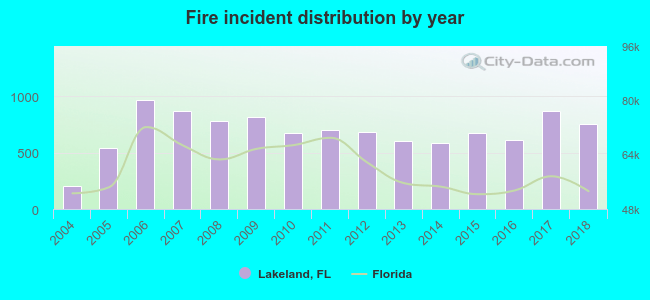 According to the data from the years 2004 - 2018 the average number of fires per year is 690. The highest number of reported fires - 964 took place in 2006, and the least - 207 in 2004. The data has an increasing trend.
The average number of yearly fire incidents per 10k residents in Lakeland, FL compared to nearest cities:
(Note: Based on data for the last 3 years, including only cities with population 5,000 and above)
| Lakeland: | 72.9 |
| Kathleen: | 1.6 |
| Highland City: | 0.9 |
| Auburndale: | 92.3 |
| Plant City: | 49.4 |
| Bartow: | 82.0 |
| Winter Haven: | 100.1 |
| Lake Alfred: | 43.8 |
| Wahneta: | 5.9 |
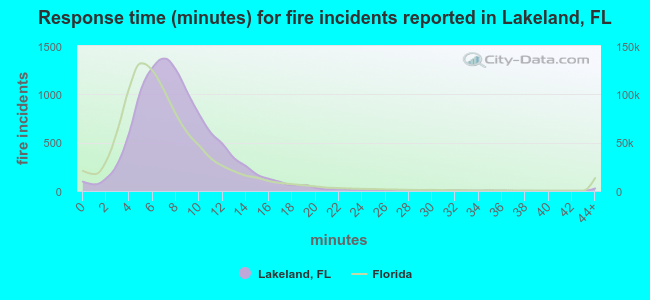 The median response time based on all reported fire incidents is 8 minutes. This is higher than the state median value.
The median response time in Lakeland, FL compared to nearest cities:
(Note: Based on data for all years, including only cities with at least 500 fire incidents)
| Lakeland: | 8 minutes |
| Mulberry: | 9 minutes |
| Auburndale: | 6 minutes |
| Plant City: | 6 minutes |
| Polk City: | 11 minutes |
| Bartow: | 8 minutes |
| Winter Haven: | 8 minutes |
| Lake Alfred: | 5 minutes |
| Zephyrhills: | 7 minutes |
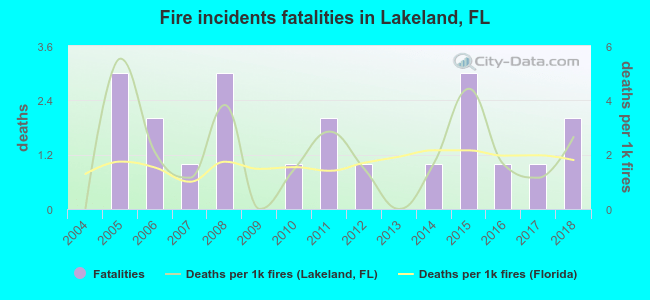 Based on the data from the years 2004 - 2018 the average number of fire-related fatalities per year is 1. The highest number of reported deaths - 3 took place in 2005, and the lowest - 0 in 2004. The data has an increasing trend.
The average number of deaths per 1,000 fire incidents is 2. This indicator was the highest - 6 in 2005, and the lowest 0 in 2004. The trend for fatalities per 1,000 fire incidents is rising. Compared to the Florida value the number of fatalities per 1,000 incidents is about the same.
Based on the data from the years 2004 - 2018 the average number of fire-related fatalities per year is 1. The highest number of reported deaths - 3 took place in 2005, and the lowest - 0 in 2004. The data has an increasing trend.
The average number of deaths per 1,000 fire incidents is 2. This indicator was the highest - 6 in 2005, and the lowest 0 in 2004. The trend for fatalities per 1,000 fire incidents is rising. Compared to the Florida value the number of fatalities per 1,000 incidents is about the same.Deaths per 1,000 incidents in Lakeland, FL compared to nearest cities:
(Note: Based on data for all years, including only cities with at least 2,500 fire incidents)
| Lakeland: | 2.0 |
| Plant City: | 2.6 |
| Bartow: | 3.4 |
| Winter Haven: | 2.4 |
| Lake Wales: | 1.9 |
| Tampa: | 2.0 |
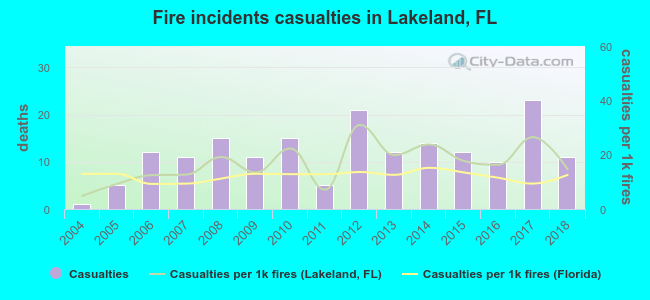 According to the reports from the years 2004 - 2018 the average number of fire-related casualties per year is 12. The highest number of reported injuries - 23 took place in 2017, and the lowest - 1 in 2004. The data has a growing trend.
The average number of injuries per 1,000 fire incidents is 17. This indicator was the highest - 31 in 2012, and the lowest 5 in 2004. The trend for casualties per 1,000 fires is rising. Compared to the Florida value the number of injuries per 1,000 fires is higher.
According to the reports from the years 2004 - 2018 the average number of fire-related casualties per year is 12. The highest number of reported injuries - 23 took place in 2017, and the lowest - 1 in 2004. The data has a growing trend.
The average number of injuries per 1,000 fire incidents is 17. This indicator was the highest - 31 in 2012, and the lowest 5 in 2004. The trend for casualties per 1,000 fires is rising. Compared to the Florida value the number of injuries per 1,000 fires is higher.Casualties per 1,000 incidents in Lakeland, FL compared to nearest cities:
(Note: Based on data for all years, including only cities with at least 500 fire incidents)
| Lakeland: | 17.2 |
| Mulberry: | 7.0 |
| Auburndale: | 5.6 |
| Plant City: | 26.6 |
| Polk City: | 4.9 |
| Bartow: | 9.0 |
| Winter Haven: | 6.2 |
| Lake Alfred: | 5.2 |
| Zephyrhills: | 26.0 |
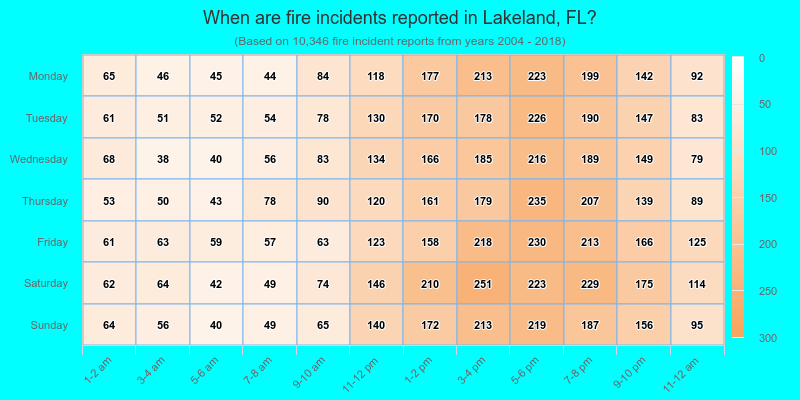
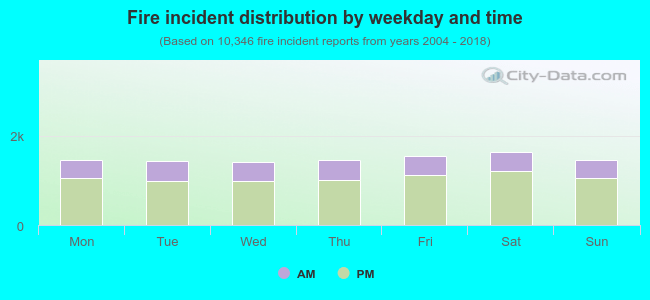 28.6% incidents where reported in the morning and 71.4% in the evening. The most fires (15.8%) took place on Saturday, and the least (13.6%) on Wednesday.
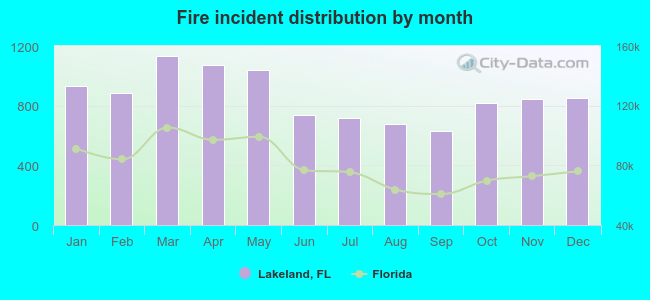 According to the 10,346 reports from years 2004 - 2018 most fires (11.0%) took place during March, and the least (6.1%) in September.
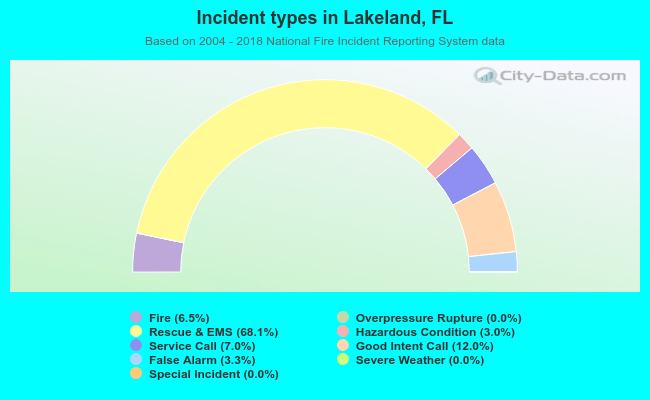 Out of all 159,064 cases reported during the years 2004 - 2018, the most belonged to the categories: Rescue & EMS (68.1%), Good Intent Call (12.0%), and Service Call (7.0%).
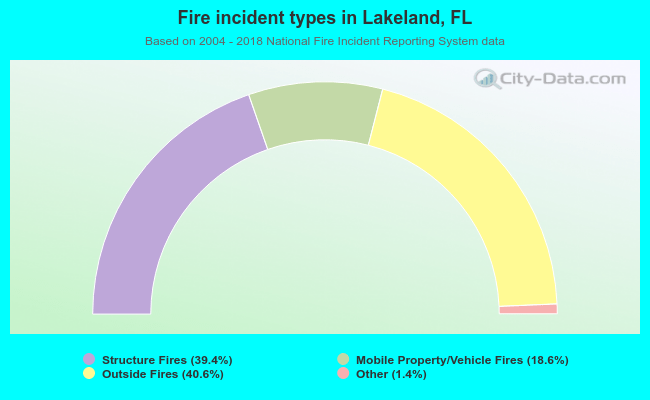 When looking into fire subcategories, the most incidents belonged to: Outside Fires (40.6%), and Structure Fires (39.4%).