Lakin: Fire Incidents, Kansas (KS)
Where are fire incidents reported in Lakin, KS
Something went wrong! Please refresh the page.
|
| |||||||||||||||||||||||||||||||||||||||||||||
| Other | 320 | |||||||||||||||||||||||||||||||||||||||||||||
2002 - 2018 National Fire Incident Reporting System (NFIRS) incidents
- Incident types reported to NFIRS in Lakin, KS
- 36472.5%Fire
- 9017.9%Hazardous Condition
- 255.0%Rescue & EMS
- 173.4%Good Intent Call
- 30.6%False Alarm
- 30.6%Severe Weather
- Fire incident types reported to NFIRS in Lakin, KS
- 24467.0%Outside Fires
- 4712.9%Mobile Property/Vehicle Fires
- 3710.2%Other
- 369.9%Structure Fires
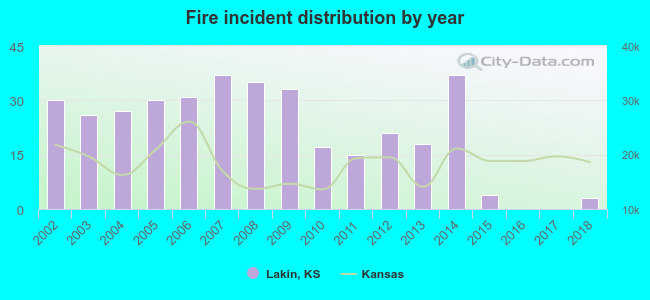 Based on the data from the years 2002 - 2018 the average number of fires per year is 21. The highest number of reported fires - 37 took place in 2007, and the least - 0 in 2016. The data has a dropping trend.
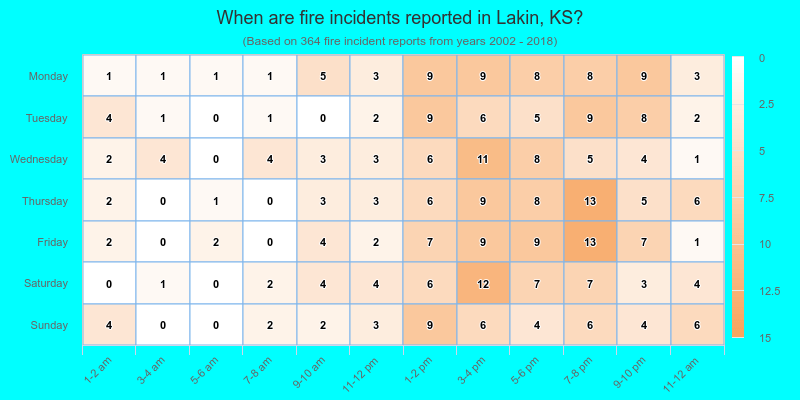
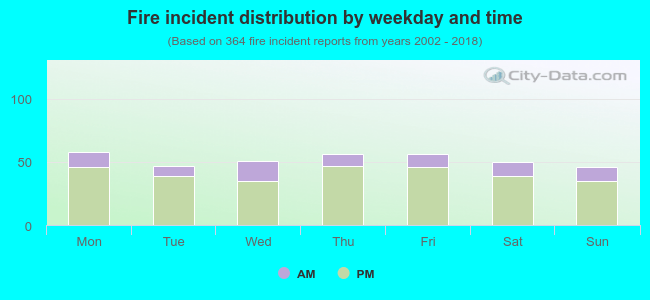 21.2% incidents where reported in the morning and 78.8% in the evening. The most fires (15.9%) took place on Monday, and the least (12.6%) on Sunday.
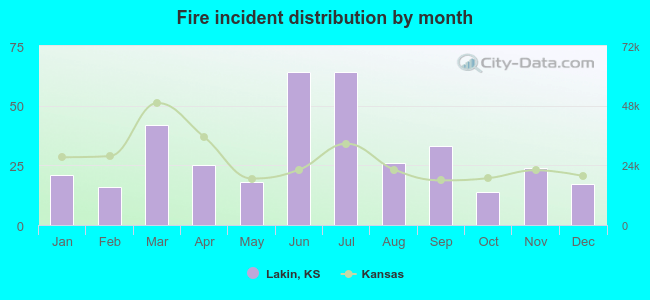 According to the 364 reports from years 2002 - 2018 most fires (17.6%) took place during June, and the least (3.8%) in October.
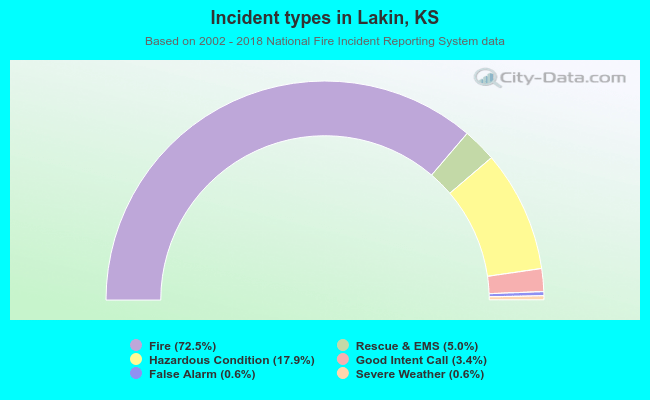 Out of all 502 cases reported during the years 2002 - 2018, the most belonged to the categories: Fire (72.5%), Rescue & EMS (17.9%), and Overpressure Rupture (5.0%).
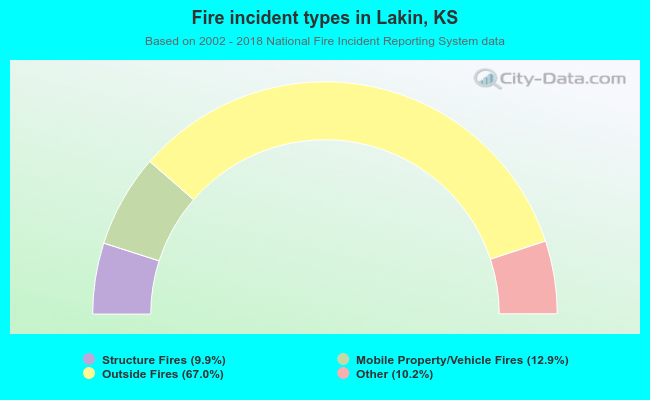 When looking into fire subcategories, the most incidents belonged to: Outside Fires (67.0%), and Mobile Property/Vehicle Fires (12.9%).