Lamar: Fire Incidents, Colorado (CO)
Where are fire incidents reported in Lamar, CO
Something went wrong! Please refresh the page.
|
| |||||||||||||||||||||||||||||||||||||||||||||||||||||||||||||||||||||||||||||||||||||||||||||||||||||||||||||
2002 - 2018 National Fire Incident Reporting System (NFIRS) incidents
- Incident types reported to NFIRS in Lamar, CO
- 1,16437.4%Fire
- 99231.9%Hazardous Condition
- 40112.9%Rescue & EMS
- 31910.2%False Alarm
- 1534.9%Good Intent Call
- 622.0%Service Call
- 140.4%Special Incident
- 60.2%Severe Weather
- Fire incident types reported to NFIRS in Lamar, CO
- 51744.4%Outside Fires
- 42936.9%Structure Fires
- 16614.3%Mobile Property/Vehicle Fires
- 524.5%Other
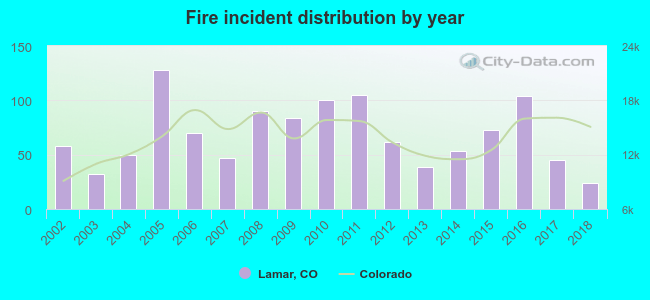 Based on the data from the years 2002 - 2018 the average number of fire incidents per year is 68. The highest number of fire incidents - 128 took place in 2005, and the least - 24 in 2018. The data has a decreasing trend.
The average number of yearly fire incidents per 10k residents in Lamar, CO compared to nearest cities:
(Note: Based on data for the last 3 years, including only cities with population 5,000 and above)
| Lamar: | 75.8 |
| La Junta: | 143.6 |
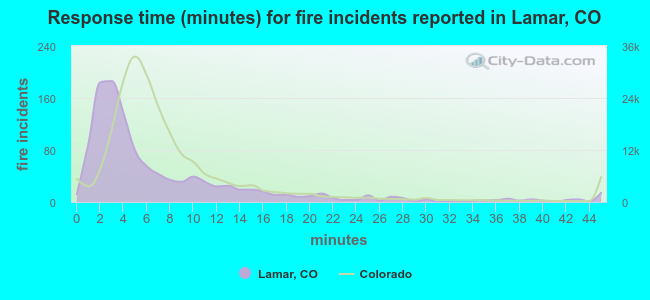 The median response time based on all reported fire incidents is 4 minutes. This is lower compared to the state median value.
The median response time in Lamar, CO compared to nearest cities:
(Note: Based on data for all years, including only cities with at least 500 fire incidents)
| Lamar: | 4 minutes |
| La Junta: | 8 minutes |
| Rocky Ford: | 5 minutes |
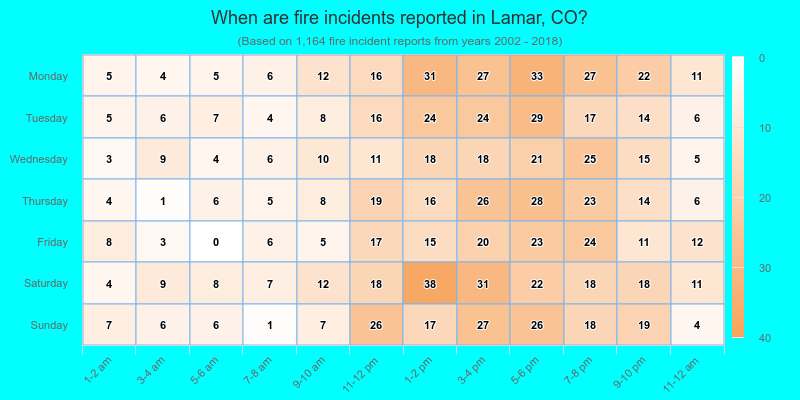
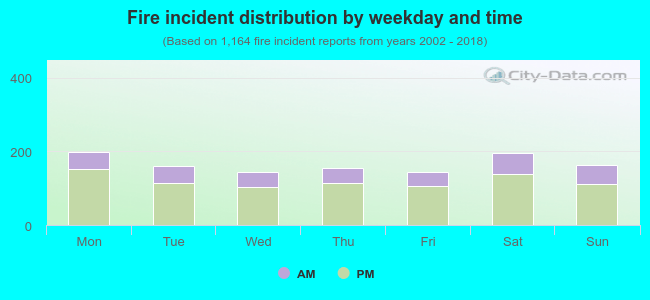 28.4% incidents where reported in the morning and 71.6% in the evening. The most fires (17.1%) took place on Monday, and the least (12.4%) on Friday.
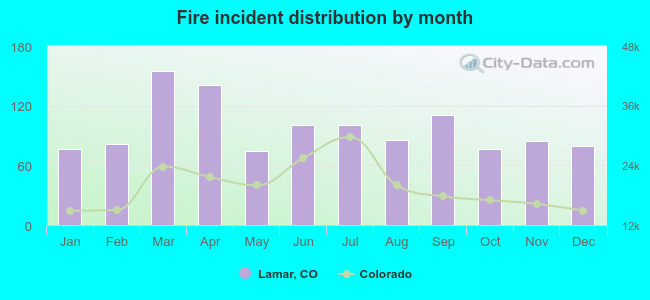 According to the 1,164 incident reports from years 2002 - 2018 most fires (13.3%) took place during March, and the least (6.4%) in May.
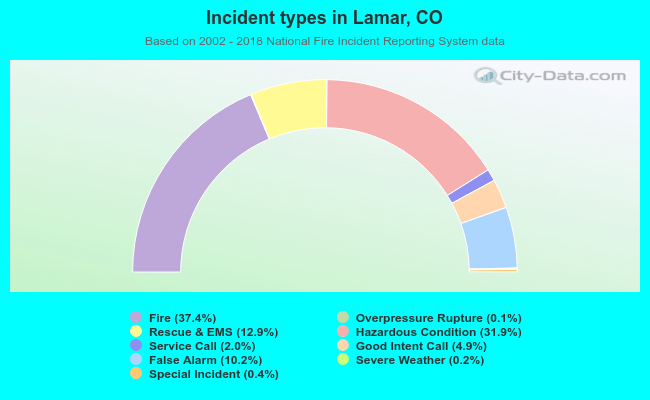 Out of all 3,114 cases reported during the years 2002 - 2018, the most belonged to the categories: Fire (37.4%), Hazardous Condition (31.9%), and Rescue & EMS (12.9%).
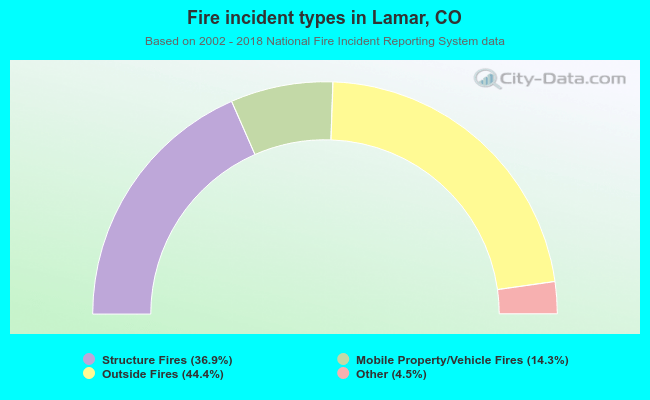 When looking into fire subcategories, the most reports belonged to: Outside Fires (44.4%), and Structure Fires (36.9%).