| Fire incidents reported |
|---|
| Sreet name | Count |
|---|
| 4283 BUTLER TER | 10 | | 4419 ELLIS TER | 8 | | 4366 DOUGLASS RD | 6 | | 4619 FINNEY RD | 6 | | 6TH CEDAR | 6 | | 1042 VIRGINIA RD | 4 | | 1100 VERMONT RD | 4 | | 1100 VIRGINIA TER | 4 | | 1133 VERMONT TER | 4 | | 1336 VERMONT RD | 4 | | 1536 VIRGINIA RD | 4 | | 169 HWY | 4 | | 37936 PLEASANT VALLEY RD | 4 | | 379TH ST | 4 | | 391ST ST | 4 | | 395TH ST | 4 | | 4256 CLOUD RD | 4 | | 4318 FINNEY RD | 4 | | 455 VIRGINIA TER | 4 | | 4600 FINNEY RD | 4 | | 4654 HAMILTON RD | 4 | | 468 VIRGINIA TER | 4 | | 500 VIRGINIA RD | 4 | | 703 SOUTH KANSAS AVE | 4 | | 750 UTAH TER | 4 |
| | | Fire incidents reported |
|---|
| Sreet name | Count |
|---|
| 824 S. KANSAS AVE | 4 | | 850 VIRGINIA RD | 4 | | BUTLER TER | 4 | | TIMBER LAKE ESTATES | 4 | | VIRGINIA TER | 4 | | 1000 OREGON RD | 2 | | 1012 VERMONT RD | 2 | | 1092 OREGON RD | 2 | | 1109 VERMONT TER | 2 | | 1121 ELLIS TER | 2 | | 1143 VIRGINIA RD | 2 | | 1143 VIRGINIA TER | 2 | | 1146 VIRGINIA TER | 2 | | 1200 VERMONT RD | 2 | | 1200 VIRGINIA RD | 2 | | 1205 OREGON RD | 2 | | 1226 MONTANA RD | 2 | | 1226 VERMONT RD | 2 | | 1246 VERMONT RD | 2 | | 129 N STATE RD | 2 | | 1299 VIRGINA TERR | 2 | | 1300 VERMONT RD | 2 | | 1354 UTAH RD | 2 | | 1382 VERMONT TER | 2 | | 1382 VERMONT TERR | 2 |
|
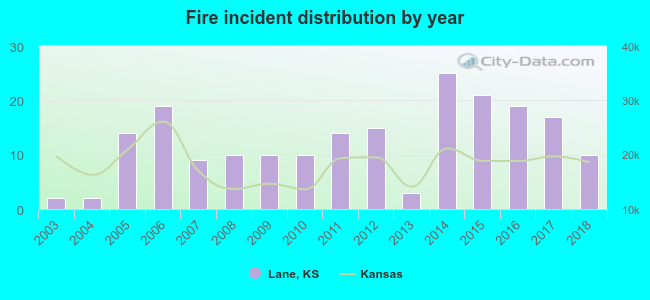 Based on the data from the years 2003 - 2018 the average number of fires per year is 13. The highest number of reported fires - 25 took place in 2014, and the least - 2 in 2003. The data has a growing trend.
 23.0% incidents where reported in the morning and 77.0% in the evening. The most fires (20.0%) took place on Wednesday, and the least (9.5%) on Thursday.
 According to the 200 reports from years 2003 - 2018 most fires (29.0%) took place during March, and the least (1.5%) in August.
 Out of all 354 cases reported during the years 2003 - 2018, the most belonged to the categories: Fire (56.5%), Overpressure Rupture (30.8%), and Service Call (7.6%).
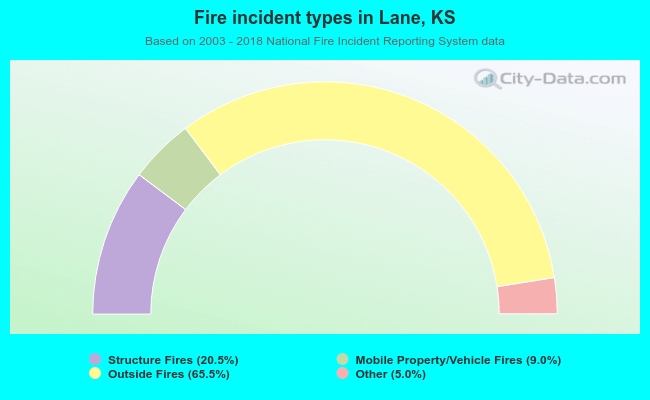 When looking into fire subcategories, the most incidents belonged to: Outside Fires (65.5%), and Structure Fires (20.5%).