Lapel: Fire Incidents, Indiana (IN)
Where are fire incidents reported in Lapel, IN
Something went wrong! Please refresh the page.
|
| |||||||||||||||||||||||||||||||||||||||||||||||||||||||||||||||||||||||||||||||||||||||||||||||||||||||||||||
2002 - 2018 National Fire Incident Reporting System (NFIRS) incidents
- Incident types reported to NFIRS in Lapel, IN
- 70555.3%Rescue & EMS
- 24719.4%Fire
- 1199.3%Service Call
- 907.1%Hazardous Condition
- 604.7%Good Intent Call
- 463.6%False Alarm
- 40.3%Special Incident
- 30.2%Overpressure Rupture
- 20.2%Severe Weather
- Fire incident types reported to NFIRS in Lapel, IN
- 12048.6%Structure Fires
- 9136.8%Outside Fires
- 239.3%Mobile Property/Vehicle Fires
- 135.3%Other
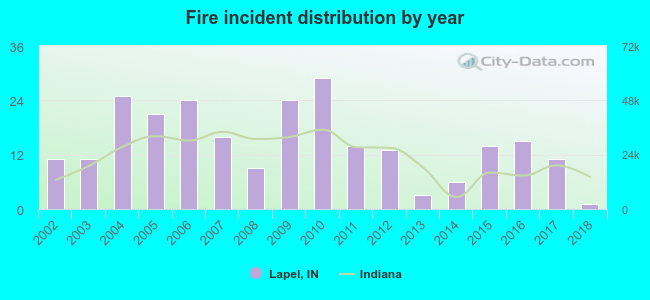 According to the data from the years 2002 - 2018 the average number of fire incidents per year is 15. The highest number of fire incidents - 29 took place in 2010, and the least - 1 in 2018. The data has a declining trend.
 29.1% incidents where reported in the morning and 70.9% in the evening. The most fires (18.2%) took place on Sunday, and the least (8.9%) on Saturday.
 According to the 247 fire incident reports from years 2002 - 2018 most fires (15.4%) took place during April, and the least (4.0%) in July.
 Out of all 1,276 cases reported during the years 2002 - 2018, the most belonged to the categories: Rescue & EMS (55.3%), Fire (19.4%), and Service Call (9.3%).
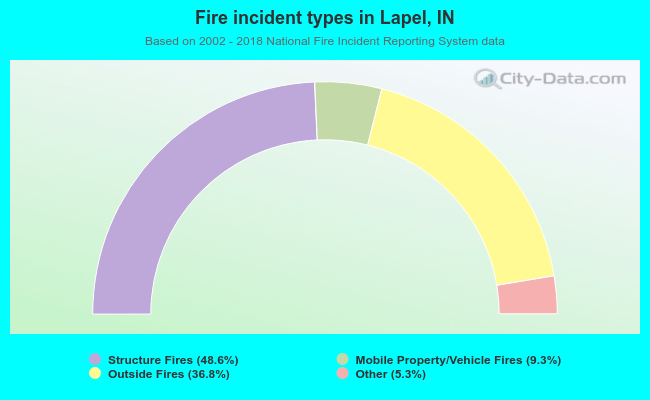 When looking into fire subcategories, the most reports belonged to: Structure Fires (48.6%), and Outside Fires (36.8%).