Larose: Fire Incidents, Louisiana (LA)
Where are fire incidents reported in Larose, LA
Something went wrong! Please refresh the page.
|
| |||||||||||||||||||||||||||||||||||||||||||||||||||||||||||||||||||||||||||||||||||||||||||||||||||||||||||||
2003 - 2018 National Fire Incident Reporting System (NFIRS) incidents
- Incident types reported to NFIRS in Larose, LA
- 40132.5%Rescue & EMS
- 35929.1%Fire
- 17013.8%Hazardous Condition
- 12310.0%Good Intent Call
- 1189.6%False Alarm
- 574.6%Service Call
- 40.3%Severe Weather
- 30.2%Overpressure Rupture
- Fire incident types reported to NFIRS in Larose, LA
- 21459.6%Outside Fires
- 9125.3%Structure Fires
- 5214.5%Mobile Property/Vehicle Fires
- 20.6%Other
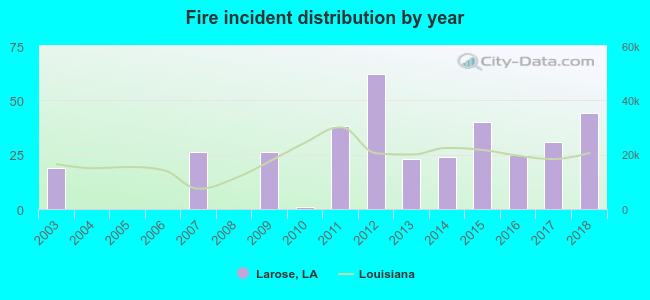 According to the data from the years 2003 - 2018 the average number of fires per year is 22. The highest number of fires - 62 took place in 2012, and the least - 0 in 2004. The data has an increasing trend.
The average number of yearly fire incidents per 10k residents in Larose, LA compared to nearest cities:
(Note: Based on data for the last 3 years, including only cities with population 5,000 and above)
| Larose: | 45.0 |
| Cut Off: | 59.1 |
| Galliano: | 66.0 |
| Raceland: | 64.4 |
| Houma: | 70.9 |
| Luling: | 26.4 |
| Gray: | 16.1 |
| Waggaman: | 26.3 |
| Central: | 0.7 |
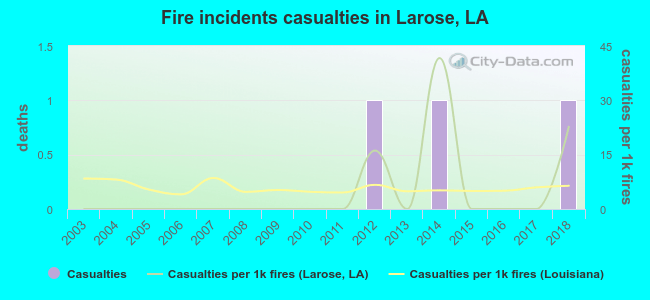 According to the data from the years 2003 - 2018 the average number of fire-related casualties per year is 0. The highest number of reported injuries - 1 took place in 2012, and the lowest - 0 in 2003. The data has a rising trend.
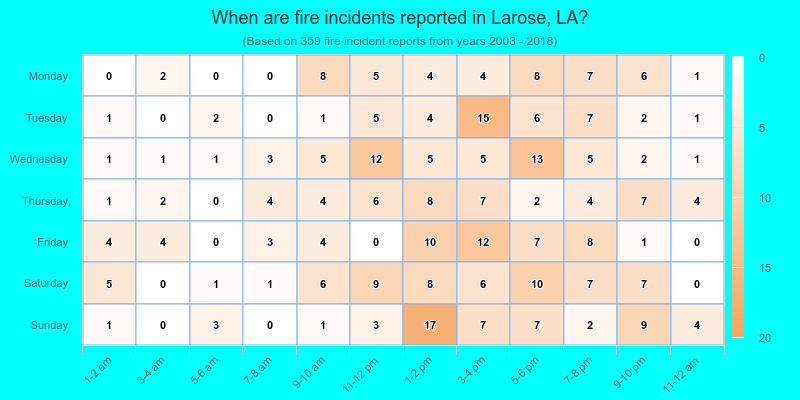
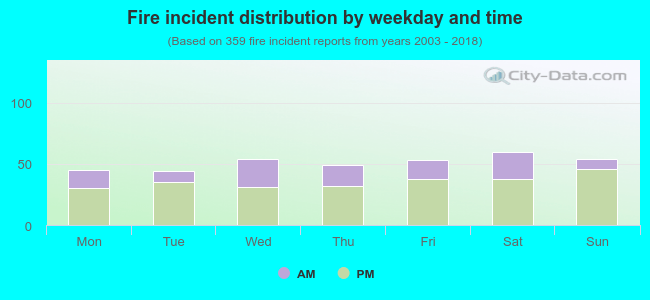 30.4% incidents where reported in the morning and 69.6% in the evening. The most fires (16.7%) took place on Saturday, and the least (12.3%) on Tuesday.
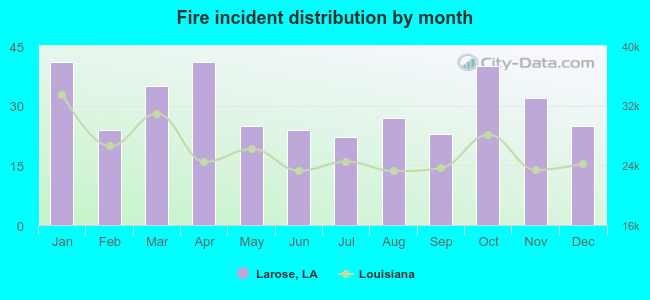 According to the 359 fire incident reports from years 2003 - 2018 most fires (11.4%) took place during January, and the least (6.1%) in July.
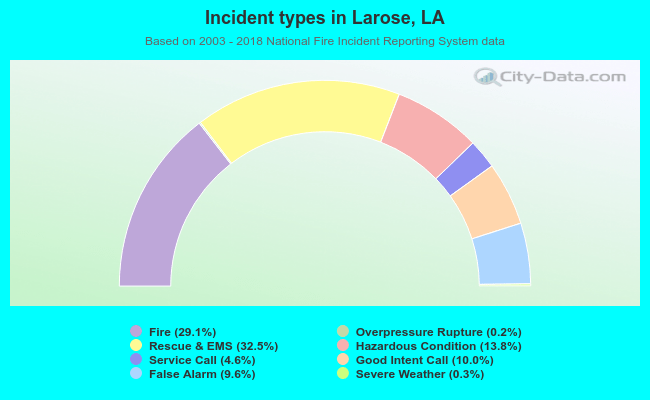 Out of all 1,235 cases reported during the years 2003 - 2018, the most belonged to the categories: Rescue & EMS (32.5%), Fire (29.1%), and Hazardous Condition (13.8%).
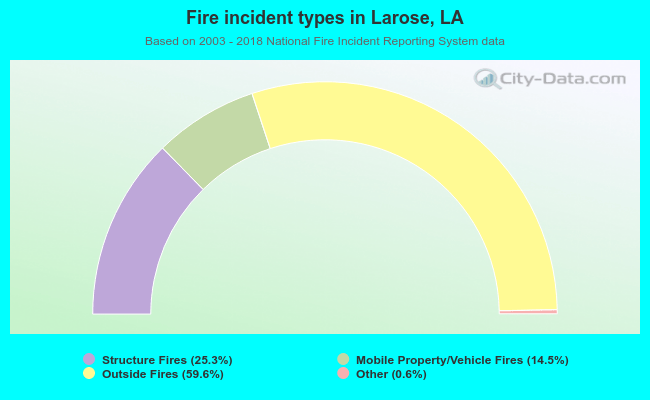 When looking into fire subcategories, the most incidents belonged to: Outside Fires (59.6%), and Structure Fires (25.3%).