| Fire incidents reported |
|---|
| Sreet name | Count |
|---|
| US 30 HWY | 32 | | BLAZER HWY | 14 | | DEMPSEY CREEK RD | 10 | | MAIN ST | 8 | | OLD OREGON TRAIL RD | 8 | | BOB SMITH CREEK RD | 6 | | CENTER ST | 6 | | FISH CREEK RD | 6 | | TOPAZ RD | 6 | | US HWY 30 | 6 | | US30 HWY | 6 | | BLAZER HWY | 4 | | DEPOT HILL RD | 4 | | HENDERSON CANYON RD | 4 | | MARSH CREEK RD | 4 | | MAUGHAN RD | 4 | | PHEASANT DR | 4 | | US HIGHWAY 30 | 4 | | 1156 HWY 30 | 2 | | 1ST ALY | 2 | | 2ND | 2 | | 2ND WEST ST | 2 | | 4TH EAST ST | 2 | | 5TH WEST ST | 2 | | BALDY MOUNTAIN RD | 2 |
| | | Fire incidents reported |
|---|
| Sreet name | Count |
|---|
| BEAVER DAM BASIN ROAD | 2 | | BEECH HOLLOW RD | 2 | | BOOTH ST | 2 | | BRISTOL LN | 2 | | BRISTOL PARK LANE ST | 2 | | BRISTOL PARK LN | 2 | | BRISTOL RD | 2 | | CNF BOUNDARY TRAIL | 2 | | COUGAR RD | 2 | | DEER CREEK RD | 2 | | DEMPSEY CREEK | 2 | | DEMPSEY CREEK ROAD | 2 | | EAST MAIN | 2 | | ELM | 2 | | ELM ST | 2 | | FIFE ST | 2 | | FRANDSEN RD | 2 | | GARARD RD | 2 | | GLEN ABBEY DR | 2 | | GUNNEL RD | 2 | | HADLEY CANYON ROAD | 2 | | HARKNESS CANYON RD | 2 | | HAWKINS RD | 2 | | HIGH COUNTRY RD | 2 | | |
|
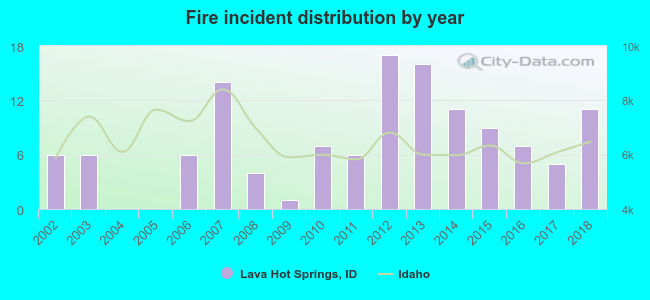 According to the data from the years 2002 - 2018 the average number of fires per year is 7. The highest number of fire incidents - 17 took place in 2012, and the least - 0 in 2004. The data has a rising trend.
 22.2% incidents where reported in the morning and 77.8% in the evening. The most fires (19.8%) took place on Sunday, and the least (10.3%) on Tuesday.
 Based on the 126 reports from years 2002 - 2018 most fires (30.2%) took place during July, and the least (0.8%) in February.
 Out of all 907 cases reported during the years 2002 - 2018, the most belonged to the categories: Rescue & EMS (70.0%), Fire (13.9%), and Good Intent Call (7.7%).
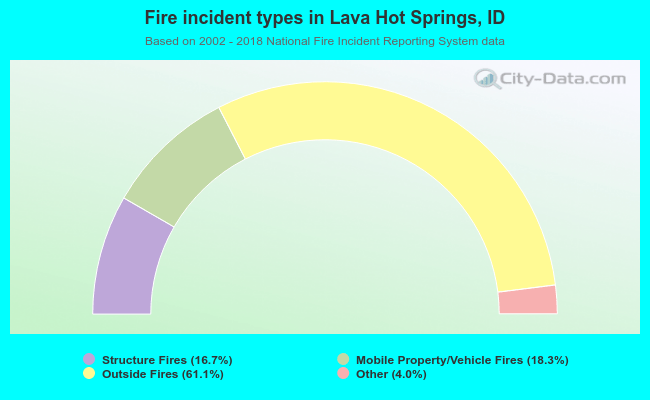 When looking into fire subcategories, the most reports belonged to: Outside Fires (61.1%), and Mobile Property/Vehicle Fires (18.3%).