| Fire incidents reported |
|---|
| Sreet name | Count |
|---|
| GRAND CENTRAL (RT.35 N) AVE | 14 | | NEWARK AVE | 12 | | BAY BLVD | 10 | | BOND AVE | 8 | | GRAND CENTRAL AVE | 8 | | MAGEE AVE | 8 | | LAVALLETTE AVE | 6 | | NORMAN CT | 6 | | PERSHING BLVD | 6 | | ROUTE 35 | 6 | | TRENTON AVE | 6 | | 4TH AVE | 4 | | 5TH AVE | 4 | | BAYBERRY WAY | 4 | | BULLARD DR | 4 | | DICKMAN DR | 4 | | DUNE WAY | 4 | | HWY. 35 | 4 | | KITTIWAKE AVE | 4 | | LAUDERDALE DR | 4 | | NEW YORK AVE | 4 | | PENNSYLVANIA AVE | 4 | | PHILADELPHIA AVE | 4 | | REESE AVE | 4 | | SANDPIPER WAY | 4 |
| | | Fire incidents reported |
|---|
| Sreet name | Count |
|---|
| TUNA WAY | 4 | | WESTMONT AVE | 4 | | WHITE AVE | 4 | | ATLANTIC WAY | 2 | | BALTIMORE AVE | 2 | | BAY SHORE DR | 2 | | BAY WAY | 2 | | BAYBERRY RD | 2 | | BAYVIEW DR | 2 | | BROWN AVE | 2 | | BRYN MAWR AVE | 2 | | CAMDEN AVE | 2 | | CHANNEL WAY | 2 | | DIANE LN | 2 | | ELIZABETH AVE | 2 | | GRAND CENTRAL PKY | 2 | | GUYER AVE | 2 | | HARBOR CT | 2 | | JERSEY CITY AVE | 2 | | KATHERYN ST | 2 | | KATHRYN ST | 2 | | KEITH LN | 2 | | KINGFISHER WAY | 2 | | NEW JERSEY AVE | 2 | | NEW YORK AVE | 2 |
|
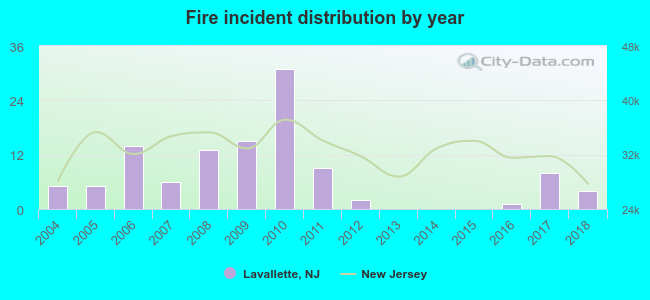 According to the data from the years 2004 - 2018 the average number of fire incidents per year is 8. The highest number of fire incidents - 31 took place in 2010, and the least - 0 in 2013. The data has a decreasing trend.
 27.4% incidents where reported in the morning and 72.6% in the evening. The most fires (19.5%) took place on Saturday, and the least (7.1%) on Friday.
 Based on the 113 incident reports from years 2004 - 2018 most fires (17.7%) took place during May, and the least (3.5%) in November.
 Out of all 544 cases reported during the years 2004 - 2018, the most belonged to the categories: Hazardous Condition (61.0%), Fire (20.8%), and False Alarm (8.8%).
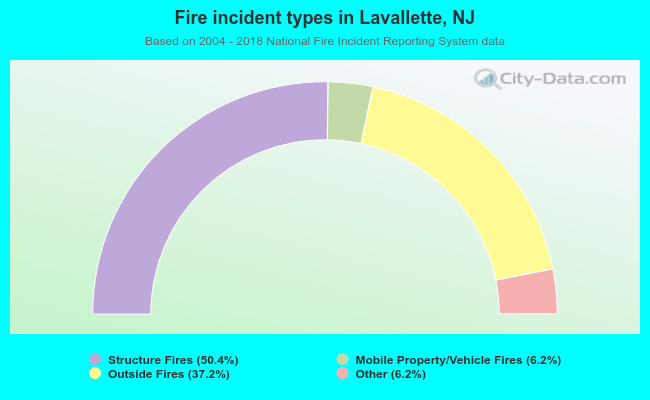 When looking into fire subcategories, the most reports belonged to: Structure Fires (50.4%), and Outside Fires (37.2%).