| Fire incidents reported |
|---|
| Sreet name | Count |
|---|
| HWY H | 22 | | 2460 DAVIS VALLEY RD | 6 | | H HWY | 6 | | KITCHEN RD | 6 | | POWERS RD | 6 | | SERVICE RD | 6 | | FLETCHER RD | 4 | | I-44 | 4 | | KEYES RD | 4 | | NEFF RD | 4 | | OLD LEASBURG RD | 4 | | #15 NEFF RD. | 2 | | #47 HARMONS RETREAT LN. RD | 2 | | 1 MILE WEST OF HWY. H ON HWY66 | 2 | | 1058 HWY H | 2 | | 109 NIXON SCHOOL RD | 2 | | 1136 HWY H | 2 | | 1369 HWY H | 2 | | 1369 HWY. H | 2 | | 1487 POSSUM H. RD. | 2 | | 1549 SARANAC SPRING RD | 2 | | 1549 SERANAC SPRINGS RD. | 2 | | 1587 STUEBER RD | 2 | | 1595 NIXON SCHOOL RD. | 2 | | 1623 FOREST HILL RD. | 2 |
| | | Fire incidents reported |
|---|
| Sreet name | Count |
|---|
| 1677 HWY. H | 2 | | 194 FORT WESTSIDE | 2 | | 210 FIRST SREET | 2 | | 213 EASTBOUND I-44 | 2 | | 215 WEST B. BY I-44@N. SERV. R | 2 | | 215.6 I44 EAST BOUND | 2 | | 219 I44 EAST BOUND | 2 | | 220 GRASSY KNOLL LANE RD | 2 | | 2380 KITCHEN ROAD | 2 | | 265 GREENBRIAR RD | 2 | | 2932 HWY H | 2 | | 2945 NIXON SCHOOL RD. | 2 | | 349 COUNTRY VIEW | 2 | | 3650 HWY H | 2 | | 384 STUEBER RD. | 2 | | 402 HWY H | 2 | | 435 LICK CREEK RD | 2 | | 4413 OLD SPRINGFIELD RD. | 2 | | 4780 OLD 66 HWY | 2 | | 479 KEYES RD | 2 | | 583 CARDINAL LANE | 2 | | 587 CARDINAL LANE | 2 | | 664FLETCHER RD. | 2 | | 673 COUNTRY ACRES LANE | 2 | | |
|
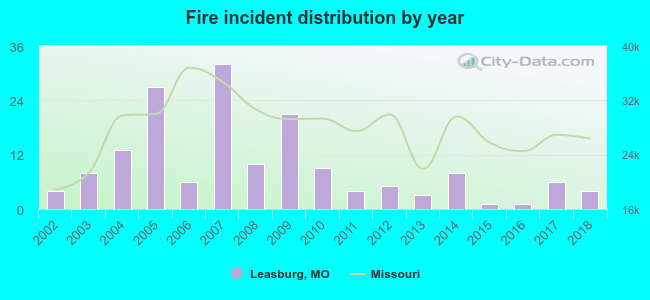 Based on the data from the years 2002 - 2018 the average number of fires per year is 10. The highest number of reported fires - 32 took place in 2007, and the least - 1 in 2015. The data has a constant trend.
 30.9% incidents where reported in the morning and 69.1% in the evening. The most fires (19.8%) took place on Saturday, and the least (8.0%) on Friday.
 Based on the 162 fire incidents from years 2002 - 2018 most fires (17.3%) took place during March, and the least (5.6%) in May.
 Out of all 269 cases reported during the years 2002 - 2018, the most belonged to the categories: Fire (60.2%), Rescue & EMS (29.7%), and Overpressure Rupture (4.8%).
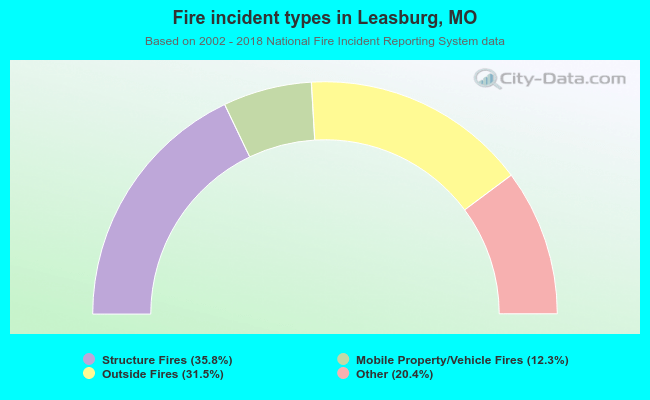 When looking into fire subcategories, the most reports belonged to: Structure Fires (35.8%), and Outside Fires (31.5%).