| Fire incidents reported |
|---|
| Sreet name | Count |
|---|
| INTERSTATE 64 FWY | 58 | | STATE ROAD 66 | 26 | | ALTON FREDONIA RD | 12 | | STATE ROAD 62 | 12 | | ALTON FREDONIA ROAD | 8 | | PARKHILL DR | 8 | | TOWER ROAD | 8 | | STATE RD 62 | 6 | | ALTON RD | 4 | | ARCHIBALD FALLS RD | 4 | | CAMP JERRY ROAD | 4 | | CARNES MILL ROAD | 4 | | DRY BRANCH ROAD | 4 | | HWY 66 | 4 | | INDUSTRIAL LN | 4 | | MAGNOLIA RD | 4 | | MAIN ST | 4 | | MANSFIELD RD | 4 | | MCCORMICK RD | 4 | | MT. STER;ING ROAD | 4 | | RIDDLE ROAD | 4 | | RIDENER RIDGE ROAD | 4 | | ST RD 62 | 4 | | STATE ROAD 66 HWY | 4 | | TOWER RD | 4 |
| | | Fire incidents reported |
|---|
| Sreet name | Count |
|---|
| 2ND ST | 2 | | 2ND STREET | 2 | | 3985 SOUTH DEVILS HOLLOWD | 2 | | 7315 VEAST PILOT KNOB RD | 2 | | ALTON ROAD | 2 | | ALTON-FREDONIA RD | 2 | | ATWOOD DR | 2 | | BEECHWOOD RD | 2 | | BEECHWOODALTON | 2 | | BOURLAND ROAD | 2 | | CAPE SANDY RD | 2 | | COURT ST | 2 | | CURBY RD | 2 | | CURBY ROAD | 2 | | DENTON ROAD | 2 | | FERDONIA RD | 2 | | HWY. 66 | 2 | | HWY. 66 HWY | 2 | | I-64 HWY | 2 | | INDUSTRIAL LANE | 2 | | MANSFIELD RD | 2 | | MANSFIELD ROAD | 2 | | MCCLURE ROAD | 2 | | ORCHARD RD | 2 | | |
|
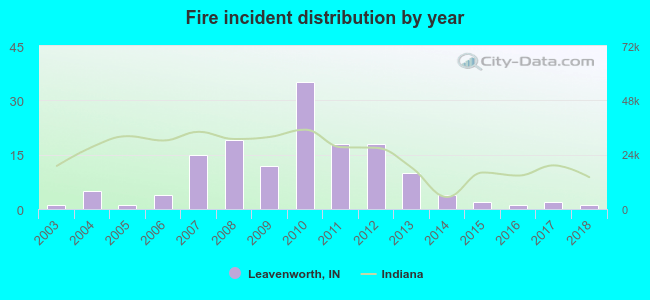 According to the data from the years 2003 - 2018 the average number of fire incidents per year is 9. The highest number of reported fires - 35 took place in 2010, and the least - 1 in 2003. The data has a constant trend.
 31.8% incidents where reported in the morning and 68.2% in the evening. The most fires (19.6%) took place on Saturday, and the least (8.1%) on Sunday.
 According to the 148 incident reports from years 2003 - 2018 most fires (12.2%) took place during October, and the least (6.1%) in January.
 Out of all 209 cases reported during the years 2003 - 2018, the most belonged to the categories: Fire (70.8%), Rescue & EMS (13.9%), and Overpressure Rupture (11.0%).
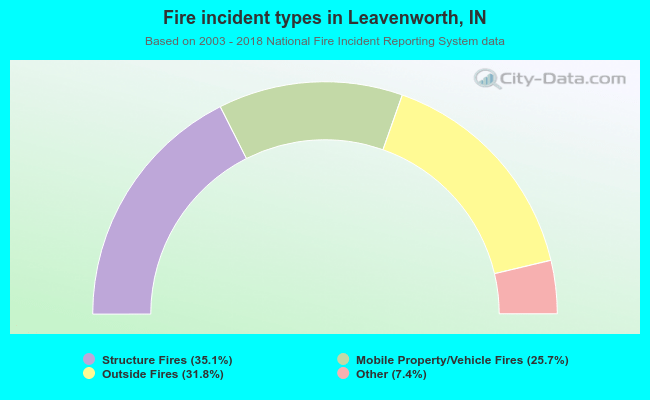 When looking into fire subcategories, the most incidents belonged to: Structure Fires (35.1%), and Outside Fires (31.8%).