| Fire incidents reported |
|---|
| Sreet name | Count |
|---|
| US INTERSTATE 78 | 38 | | MAIN ST | 20 | | MAIN STREET | 20 | | US HIGHWAY 22 | 18 | | COKESBURY ROAD | 14 | | RT 78 | 10 | | CIRCLE DR | 8 | | COKESBURY RD | 8 | | US HIGHWAY 22 EAST | 8 | | BLOSSOM HILL RD | 6 | | BLOSSOM HILL ROAD | 6 | | BRIDGE HOLLOW RD | 6 | | CHERRY STREET | 6 | | CLARK ROAD | 6 | | ESTHER CT | 6 | | OLD MOUNTAIN ROAD | 6 | | PHILHOWER RD | 6 | | RT 22 | 6 | | WELSH ROAD | 6 | | BISSELL ROAD | 4 | | CHERRY ST | 4 | | CONOVER TERR | 4 | | COUNTY ROUTE 513 | 4 | | CREEK RIM DRIVE | 4 | | EVERGREEN COURT | 4 |
| | | Fire incidents reported |
|---|
| Sreet name | Count |
|---|
| GALLOPING HILL RD | 4 | | GLOREY ROAD | 4 | | GLORY ROAD | 4 | | MONTAINE PL | 4 | | OLD FARM LANE | 4 | | OLD FARM LN | 4 | | OLD MINE RD | 4 | | OLD MOUNTAIN RD | 4 | | POTTERSTOWN ROAD | 4 | | PRUNER FARM RD | 4 | | ROCKY GLEN WAY | 4 | | ROUTE 22 WEST | 4 | | RT 629 | 4 | | RT 78 EAST | 4 | | 1015 ROUTE 22 EAST | 2 | | 12 DEER RUN | 2 | | 1462 ROUTE 22 WEST BOUND | 2 | | 15 BURLINGHOFF LANE | 2 | | 158 MAIN STREET | 2 | | 163 COKESBURY ROAD | 2 | | 19.4 MM RT 78 WEST | 2 | | 20 MOLLASSES HILL ROAD | 2 | | 22 HWY | 2 | | 224 INT 78 WEST | 2 | | |
|
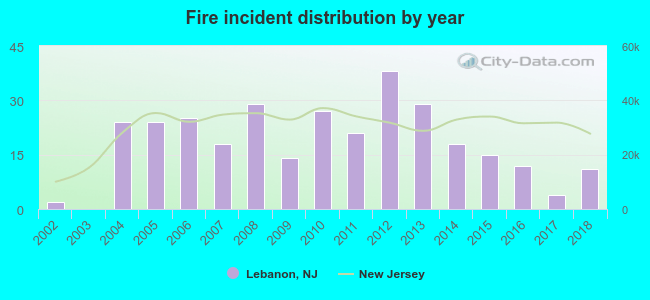 According to the data from the years 2002 - 2018 the average number of fire incidents per year is 18. The highest number of fire incidents - 38 took place in 2012, and the least - 0 in 2003. The data has an increasing trend.
 27.7% incidents where reported in the morning and 72.3% in the evening. The most fires (18.6%) took place on Saturday, and the least (10.9%) on Wednesday.
 Based on the 311 incident reports from years 2002 - 2018 most fires (10.9%) took place during April, and the least (6.4%) in October.
 Out of all 1,211 cases reported during the years 2002 - 2018, the most belonged to the categories: Hazardous Condition (32.8%), Fire (25.7%), and False Alarm (17.3%).
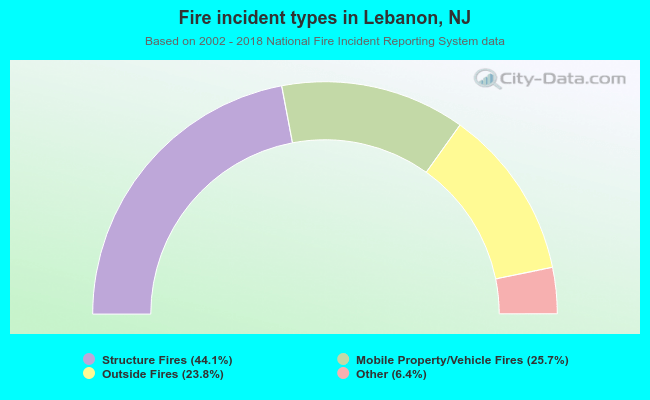 When looking into fire subcategories, the most reports belonged to: Structure Fires (44.1%), and Mobile Property/Vehicle Fires (25.7%).