| Fire incidents reported |
|---|
| Sreet name | Count |
|---|
| HWY 411 SOUTH | 38 | | COUNTY ROAD 70 | 35 | | WEISS LAKE BLVD | 30 | | LOKEY STREET | 25 | | COUNTY RD 7 | 15 | | EMBOS ISLAND ST | 15 | | COUNTY ROAD 377 | 13 | | COUNTY ROAD 7 | 13 | | HWY 273 | 13 | | COUNTY ROAD 235 | 12 | | COUNTY ROAD 44 | 12 | | HWY 411 | 12 | | 350 CO RD 110 | 10 | | COUNTY ROAD 5 | 10 | | COUNTY ROAD 50 | 10 | | CR 44 | 10 | | ELM ST | 10 | | KEENER DR | 10 | | LOKEY ST | 10 | | PARK ST | 10 | | COUNTY ROAD 146 | 9 | | HWY 68 | 9 | | INDUSTRIAL BLVD | 9 | | COUNTY ROAD 20 | 8 | | HIGHWAY 411 SOUTH | 8 |
| | | Fire incidents reported |
|---|
| Sreet name | Count |
|---|
| HIGHWAY 68 | 8 | | THOMPSON CIRCLE | 8 | | 1484 CR7 | 5 | | 150 COUNTY ROAD 562 | 5 | | 160 ELM STREET | 5 | | 230 BRISTOW GAP ROAD | 5 | | 2390 US HWY 273 | 5 | | 2533 HWY 273 | 5 | | 2535 HIGHWAY 273 | 5 | | 285 COUNTY ROAD 315 | 5 | | 3495 CO RD 44 | 5 | | 3870 WEISS LAKE BLVD | 5 | | 401 CR 377 | 5 | | 4020 AL HWY 68 | 5 | | 411 HWY | 5 | | 411 SO | 5 | | 433 COUNTY 235 | 5 | | 5350 CO RD 7 | 5 | | 600 COUNTY ROAD 154 | 5 | | 675 COUNTY ROAD 106 | 5 | | 68 HWY | 5 | | 690 KEENER DRIVE | 5 | | 741 COUNTY RD 106 | 5 | | 870 COUNTY ROAD 50 | 5 | | ALABAMA HWY 68 | 5 |
|
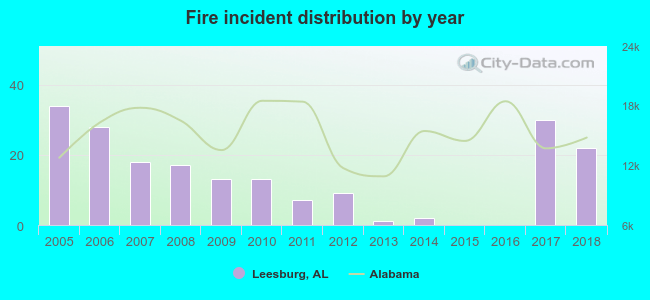 Based on the data from the years 2005 - 2018 the average number of fires per year is 14. The highest number of fire incidents - 34 took place in 2005, and the least - 0 in 2015. The data has a dropping trend.
 30.4% incidents where reported in the morning and 69.6% in the evening. The most fires (18.6%) took place on Friday, and the least (8.8%) on Thursday.
 Based on the 194 reports from years 2005 - 2018 most fires (16.0%) took place during March, and the least (4.1%) in August.
 Out of all 455 cases reported during the years 2005 - 2018, the most belonged to the categories: Fire (42.6%), Rescue & EMS (27.9%), and Hazardous Condition (16.7%).
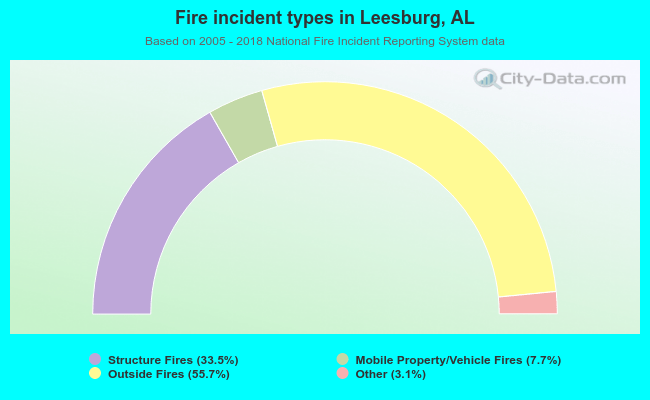 When looking into fire subcategories, the most reports belonged to: Outside Fires (55.7%), and Structure Fires (33.5%).