| Fire incidents reported |
|---|
| Sreet name | Count |
|---|
| CONNELLSVILLE RD | 8 | | EDISON ST | 8 | | COOLSPRING ST | 6 | | KIRA DR | 6 | | MAIN (LEMONT FURNACE) ST | 6 | | BRUSHWOOD RD | 4 | | BUTE RD | 4 | | CONNELLSVILLE ST | 4 | | FAN HOLLOW RD | 4 | | GALLATIN AVE | 4 | | HARDY HILL RD | 4 | | JEFFERSON ST | 4 | | MAIN ST | 4 | | OLIVER RD | 4 | | TURKEYFOOT RD | 4 | | UNIVERSITY DR | 4 | | WALLY DR | 4 | | 107 YOUNGSTOWN RD | 2 | | 1ST ST | 2 | | 310 OLD PITTSBURGH RD | 2 | | 383 YAUGER HOLLOW RD | 2 | | 3RD ST | 2 | | 57 CONNELLSVILLE ST | 2 | | 61 OLD BRADDOCK RD | 2 | | ASKREN ST | 2 |
| | | Fire incidents reported |
|---|
| Sreet name | Count |
|---|
| ATLAS XING | 2 | | BOUQUET ST | 2 | | BROADWAY STRE | 2 | | BROWNFIELD RD | 2 | | BUDDYS LN | 2 | | CELLURALE DR | 2 | | CHAFFEE ST | 2 | | CIRCLE LN | 2 | | CLARK ST | 2 | | COMO ST | 2 | | CONNELLSVILLE ROAD | 2 | | COTTAGE ST | 2 | | EDDISON BLVD | 2 | | FIDDLERS GREEN RD | 2 | | FILMORE ST | 2 | | FORBES ST | 2 | | FULTON ST | 2 | | GRANT ST | 2 | | GUN CLUB RD | 2 | | HOGSETT LA | 2 | | JUMONVILLE RD | 2 | | JUNIATA RD | 2 | | KENNEDY STREET EXT | 2 | | KIRA DR | 2 | | |
|
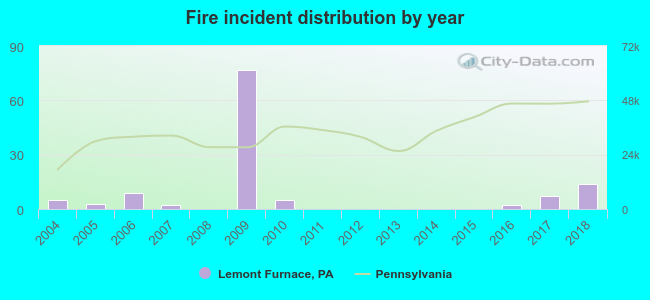 Based on the data from the years 2004 - 2018 the average number of fire incidents per year is 8. The highest number of fires - 77 took place in 2009, and the least - 0 in 2008. The data has an increasing trend.
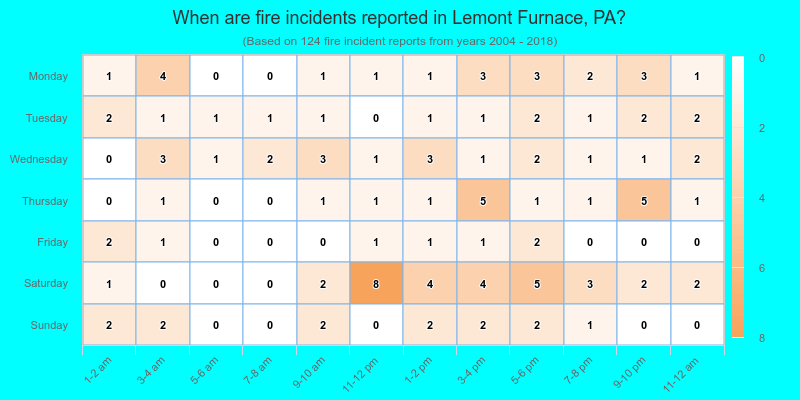
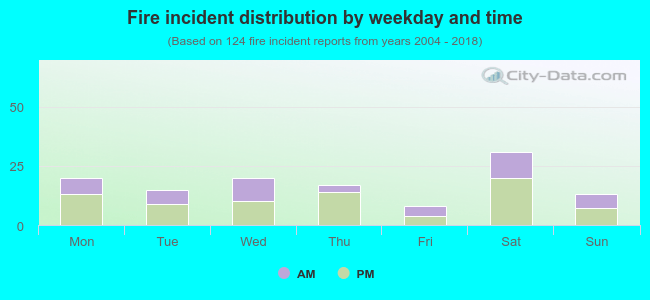 37.9% incidents where reported in the morning and 62.1% in the evening. The most fires (25.0%) took place on Saturday, and the least (6.5%) on Friday.
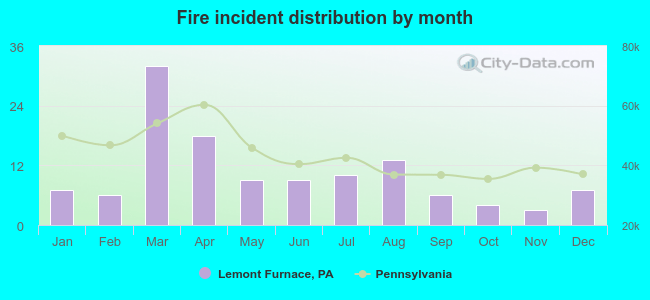 According to the 124 fires from years 2004 - 2018 most fires (25.8%) took place during March, and the least (2.4%) in November.
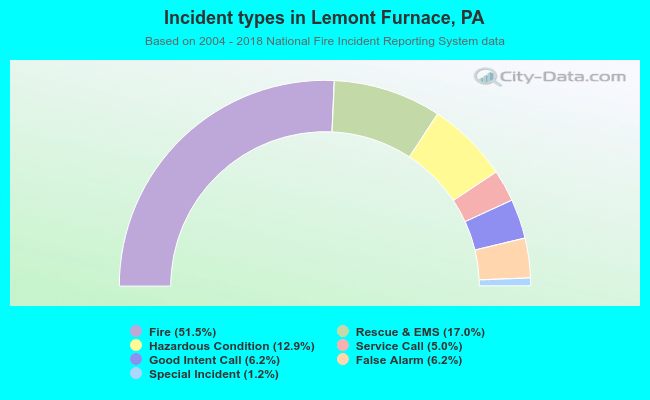 Out of all 241 cases reported during the years 2004 - 2018, the most belonged to the categories: Fire (51.5%), Overpressure Rupture (17.0%), and Rescue & EMS (12.9%).
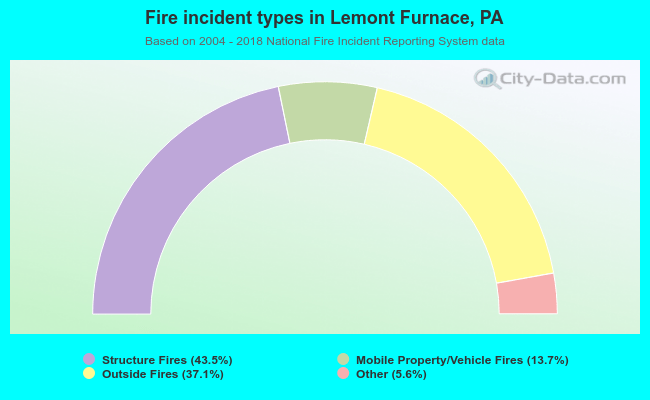 When looking into fire subcategories, the most incidents belonged to: Structure Fires (43.5%), and Outside Fires (37.1%).