| Fire incidents reported |
|---|
| Sreet name | Count |
|---|
| 31 HWY | 16 | | HWY 31 | 14 | | HWY 31 HWY | 12 | | HIGHWAY 31 HWY | 10 | | HWY 347 HWY | 8 | | CARRIER ST | 6 | | HIGHWAY 31 | 6 | | OSCAR RIVETTE RD | 6 | | AUZENNE ST | 4 | | AUZENNE ST ST | 4 | | BAYOU TECHE SUBDIVISION RD | 4 | | CHURCH RD | 4 | | CHURCH RD RD | 4 | | CHURCH ROAD | 4 | | CHURCH ST ST | 4 | | COULEE LANOIRE ST | 4 | | DOLLY LANE LN | 4 | | DOLLY LN | 4 | | HURVEY ST | 4 | | HURVEY ST ST | 4 | | HWY 347 | 4 | | HWY 741 | 4 | | LANCLOS RD | 4 | | MALLET RD | 4 | | MARCEL ST | 4 |
| | | Fire incidents reported |
|---|
| Sreet name | Count |
|---|
| MARCEL ST ST | 4 | | MOREAU RD | 4 | | OSCAR RIVETTE RD | 4 | | OSCAR RIVETTE RD RD | 4 | | ST LEO ST | 4 | | 100 CHURCH RD RD | 2 | | 1018 CHURCH RD | 2 | | 1203 HWY 741 HWY | 2 | | 132 MARCEL ST ST | 2 | | 175 LEMELLE ST | 2 | | 192 KELSEY LN | 2 | | 292 BAYOU TECHE SUBDIVISION RD | 2 | | 31 | 2 | | 314 BAYOU TECHE SUBDIVISION RD RD | 2 | | 314 BAYOU TECHE SUDIVISION RD RD | 2 | | 394 BAYOU TECHE SUBDIVISON RD | 2 | | 394 BAYOU TECHE SUBV RD | 2 | | 4639 HIGHWAY 31 HWY | 2 | | 5075 HWY 31 HWY | 2 | | 5421 HWY 31 | 2 | | 741 HWY | 2 | | BAYOU ACRES RD | 2 | | BAYOU TECHE SUBD RD RD | 2 | | BAYOU TECHE SUBDISION ROAD | 2 | | |
|
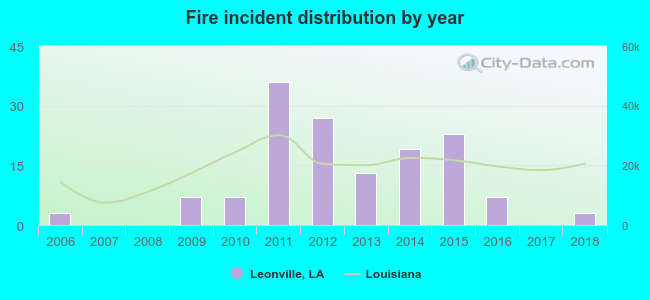 Based on the data from the years 2006 - 2018 the average number of fires per year is 11. The highest number of reported fire incidents - 36 took place in 2011, and the least - 0 in 2007. The data has a constant trend.
 28.3% incidents where reported in the morning and 71.7% in the evening. The most fires (18.6%) took place on Monday, and the least (6.9%) on Wednesday.
 Based on the 145 reports from years 2006 - 2018 most fires (12.4%) took place during May, and the least (3.4%) in June.
 Out of all 174 cases reported during the years 2006 - 2018, the most belonged to the categories: Fire (83.3%), Service Call (5.2%), and Overpressure Rupture (4.6%).
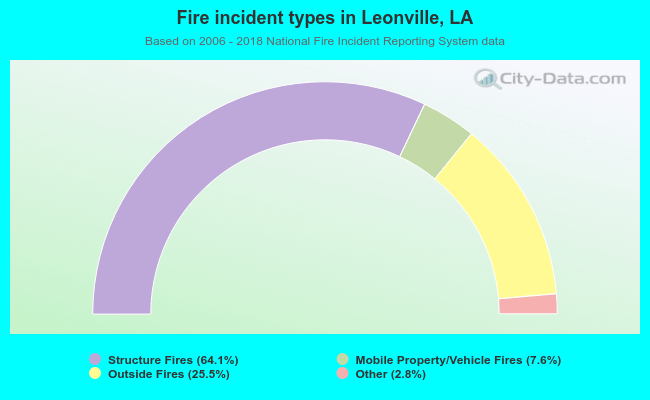 When looking into fire subcategories, the most reports belonged to: Structure Fires (64.1%), and Outside Fires (25.5%).