Lepanto: Fire Incidents, Arkansas (AR)
Where are fire incidents reported in Lepanto, AR
Something went wrong! Please refresh the page.
|
| |||||||||||||||||||||||||||||||||||||||||||||||||||||||||||||||||||||||||||||||||||||||||||||||||||||||||||||
| Other | 86 | |||||||||||||||||||||||||||||||||||||||||||||||||||||||||||||||||||||||||||||||||||||||||||||||||||||||||||||
2002 - 2018 National Fire Incident Reporting System (NFIRS) incidents
- Incident types reported to NFIRS in Lepanto, AR
- 33684.4%Fire
- 328.0%Hazardous Condition
- 164.0%Rescue & EMS
- 71.8%Service Call
- 41.0%Good Intent Call
- 10.3%Overpressure Rupture
- 10.3%False Alarm
- 10.3%Severe Weather
- Fire incident types reported to NFIRS in Lepanto, AR
- 13239.3%Structure Fires
- 10330.7%Outside Fires
- 6017.9%Mobile Property/Vehicle Fires
- 4112.2%Other
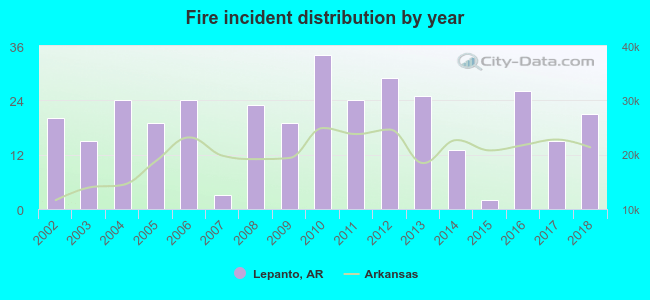 According to the data from the years 2002 - 2018 the average number of fires per year is 20. The highest number of reported fire incidents - 34 took place in 2010, and the least - 2 in 2015. The data has a rising trend.
 32.1% incidents where reported in the morning and 67.9% in the evening. The most fires (16.7%) took place on Wednesday, and the least (11.6%) on Sunday.
 Based on the 336 incident reports from years 2002 - 2018 most fires (12.5%) took place during October, and the least (6.3%) in February.
 Out of all 398 cases reported during the years 2002 - 2018, the most belonged to the categories: Fire (84.4%), Hazardous Condition (8.0%), and Rescue & EMS (4.0%).
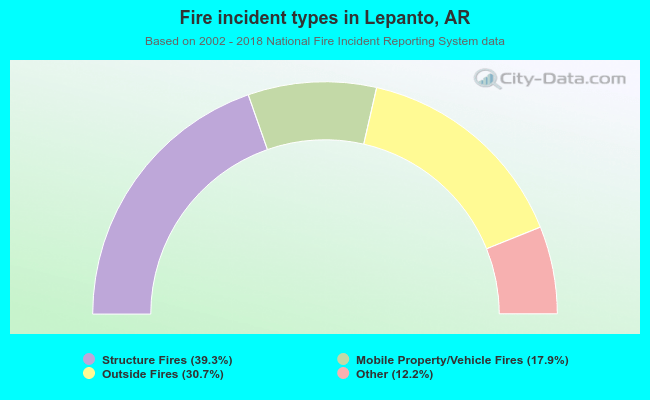 When looking into fire subcategories, the most incidents belonged to: Structure Fires (39.3%), and Outside Fires (30.7%).