| Fire incidents reported |
|---|
| Sreet name | Count |
|---|
| RIVER ROAD | 12 | | US HIGHWAY 60 W | 10 | | 334 COUNTY LINE | 8 | | GOBLER FORD RD | 8 | | 25 MARKET STREET | 6 | | CHESTNUT GROVE RD | 6 | | COMMONWEALTH ALUMINUM | 6 | | FIFTH STREET | 6 | | HIGHWAY 60 W | 6 | | PELL STREET | 6 | | SPEAKS LANE | 6 | | STATE ROUTE 657 | 6 | | THOMAS LANE | 6 | | 10256 HWY 1389 | 4 | | 10915 HWY 657 | 4 | | 1372 STATE ROUTE 1957 | 4 | | 1389 HWY | 4 | | 1668 GOBLER FORD RD | 4 | | 657 RT | 4 | | 9685 HWY 1389 | 4 | | BLUEGRASS DRIVE | 4 | | ESTES ROAD | 4 | | HENDERSON GROVE ROAD | 4 | | HIGHWAY 1389 | 4 | | HWY 60 W | 4 |
| | | Fire incidents reported |
|---|
| Sreet name | Count |
|---|
| HWY 60 WEST | 4 | | HWY 657 AND MCINTYRE | 4 | | JOHN PATE ROAD | 4 | | KY 1389 HWY | 4 | | MARKET ST | 4 | | MARKET STREET | 4 | | SKYLINE TRAILER CT. | 4 | | SKYLINE TRAILER PARK | 4 | | ST. RT. 334 | 4 | | STATE ROUTE 1957 | 4 | | STATE ROUTE 271 S | 4 | | STATE ROUTE 662 | 4 | | TOLER BRIDGE ROAD | 4 | | UTILITY LEWISPORT ROAD | 4 | | 662 | 2 | | 10301 HIGHWAY 1389 | 2 | | 10410 HWY 662 | 2 | | 10424 HWY 1389 | 2 | | 1045 PELL STREET | 2 | | 105 GRACE COURT | 2 | | 10556 HWY 662 | 2 | | 10571 HWY 1389 | 2 | | 11449 HWY 1389 | 2 | | 115 FOURTH STREET ST | 2 | | 115 NEW FRONT STREET | 2 |
|
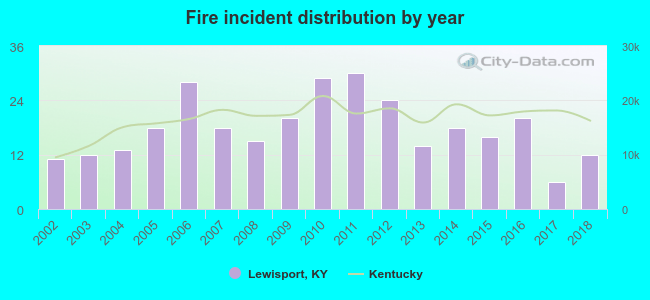 According to the data from the years 2002 - 2018 the average number of fires per year is 18. The highest number of fire incidents - 30 took place in 2011, and the least - 6 in 2017. The data has a rising trend.
 29.6% incidents where reported in the morning and 70.4% in the evening. The most fires (18.8%) took place on Saturday, and the least (10.5%) on Thursday.
 Based on the 304 fire incident reports from years 2002 - 2018 most fires (15.8%) took place during April, and the least (4.6%) in May.
 Out of all 839 cases reported during the years 2002 - 2018, the most belonged to the categories: Overpressure Rupture (39.8%), Fire (36.2%), and Service Call (10.4%).
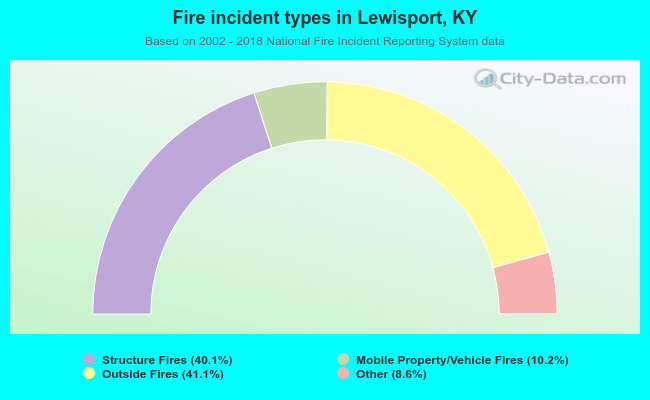 When looking into fire subcategories, the most reports belonged to: Outside Fires (41.1%), and Structure Fires (40.1%).