Lewiston: Fire Incidents, Utah (UT)
Where are fire incidents reported in Lewiston, UT
Something went wrong! Please refresh the page.
|
| |||||||||||||||||||||||||||||||||||||||||||||||||||||||||||||||||||||||||||||||||||||||||||||||||||||||||
2002 - 2018 National Fire Incident Reporting System (NFIRS) incidents
- Incident types reported to NFIRS in Lewiston, UT
- 15740.8%Rescue & EMS
- 13735.6%Fire
- 5915.3%Hazardous Condition
- 246.2%Good Intent Call
- 61.6%Service Call
- 10.3%False Alarm
- 10.3%Severe Weather
- Fire incident types reported to NFIRS in Lewiston, UT
- 6144.5%Outside Fires
- 4935.8%Structure Fires
- 1813.1%Other
- 96.6%Mobile Property/Vehicle Fires
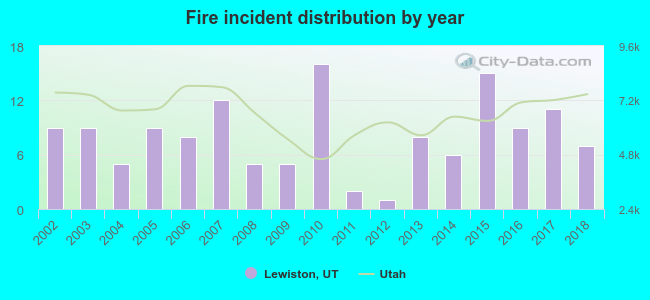 According to the data from the years 2002 - 2018 the average number of fires per year is 8. The highest number of fire incidents - 16 took place in 2010, and the least - 1 in 2012. The data has a declining trend.
 27.0% incidents where reported in the morning and 73.0% in the evening. The most fires (27.0%) took place on Saturday, and the least (5.8%) on Monday.
 Based on the 137 reports from years 2002 - 2018 most fires (13.9%) took place during July, and the least (4.4%) in December.
 Out of all 385 cases reported during the years 2002 - 2018, the most belonged to the categories: Overpressure Rupture (40.8%), Fire (35.6%), and Rescue & EMS (15.3%).
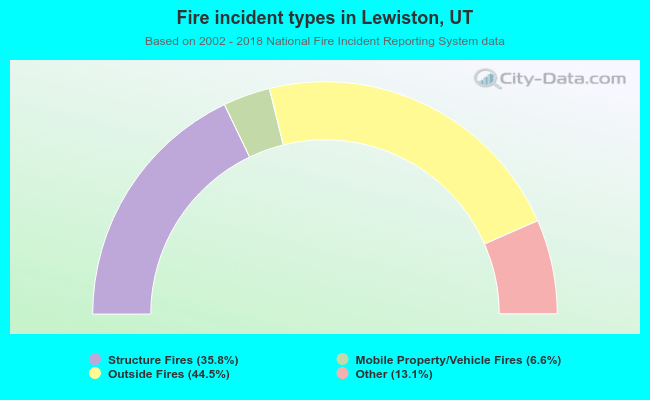 When looking into fire subcategories, the most incidents belonged to: Outside Fires (44.5%), and Structure Fires (35.8%).