Libby: Fire Incidents, Montana (MT)
Where are fire incidents reported in Libby, MT
Something went wrong! Please refresh the page.
|
| |||||||||||||||||||||||||||||||||||||||||||||||||||||||||||||||||||||||||||||||||||||||||||||||||||||||||||||
| Other | 441 | |||||||||||||||||||||||||||||||||||||||||||||||||||||||||||||||||||||||||||||||||||||||||||||||||||||||||||||
2002 - 2018 National Fire Incident Reporting System (NFIRS) incidents
- Incident types reported to NFIRS in Libby, MT
- 83351.3%Fire
- 38423.6%Hazardous Condition
- 1569.6%Rescue & EMS
- 996.1%False Alarm
- 965.9%Good Intent Call
- 523.2%Service Call
- 30.2%Overpressure Rupture
- 20.1%Special Incident
- Fire incident types reported to NFIRS in Libby, MT
- 35943.1%Structure Fires
- 33740.5%Outside Fires
- 10813.0%Mobile Property/Vehicle Fires
- 293.5%Other
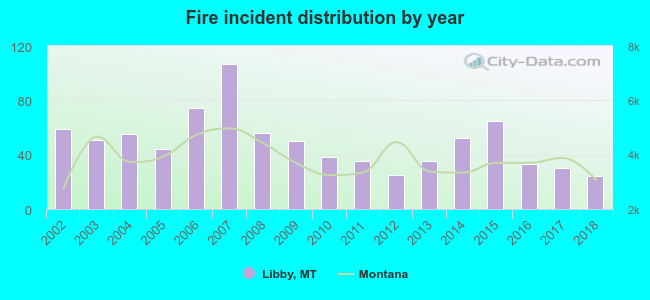 According to the data from the years 2002 - 2018 the average number of fires per year is 49. The highest number of fires - 107 took place in 2007, and the least - 24 in 2018. The data has a declining trend.
 The median response time based on all reported fire incidents is 7 minutes. This is lower than the Montana median value.
The median response time in Libby, MT compared to nearest cities:
(Note: Based on data for all years, including only cities with at least 500 fire incidents)
| Libby: | 7 minutes |
| Bonners Ferry: | 10 minutes |
| Sandpoint: | 10 minutes |
| Kalispell: | 8 minutes |
| Athol: | 12 minutes |
| Columbia Falls: | 11 minutes |
| Priest River: | 9 minutes |
| Hayden: | 9 minutes |
 Based on the data from the years 2002 - 2018 the average number of fire-related yearly deaths is 0. The highest number of reported deaths - 2 took place in 2008, and the lowest - 0 in 2002. The data has a constant trend.
 31.2% incidents where reported in the morning and 68.8% in the evening. The most fires (16.4%) took place on Saturday, and the least (13.4%) on Sunday.
 According to the 833 fire incident reports from years 2002 - 2018 most fires (18.2%) took place during July, and the least (5.5%) in May.
 Out of all 1,625 cases reported during the years 2002 - 2018, the most belonged to the categories: Fire (51.3%), Hazardous Condition (23.6%), and Rescue & EMS (9.6%).
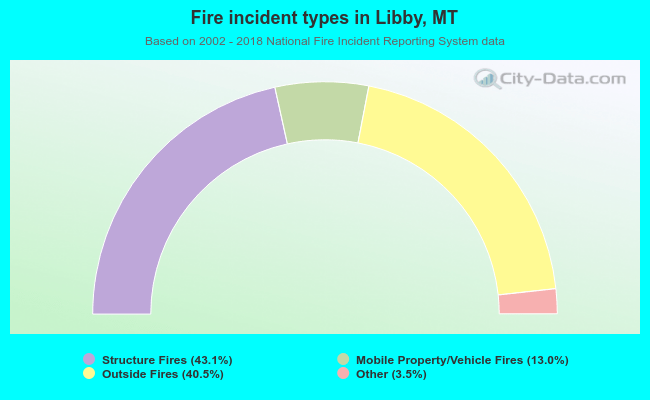 When looking into fire subcategories, the most reports belonged to: Structure Fires (43.1%), and Outside Fires (40.5%).