Liberty: Fire Incidents, Indiana (IN)
Where are fire incidents reported in Liberty, IN
Something went wrong! Please refresh the page.
|
| |||||||||||||||||||||||||||||||||||||||||||||||||||||||||||||||||||||||||||||||||||||||||||||||||||||||||||||
2003 - 2018 National Fire Incident Reporting System (NFIRS) incidents
- Incident types reported to NFIRS in Liberty, IN
- 17045.6%Fire
- 11731.4%Hazardous Condition
- 4612.3%Rescue & EMS
- 215.6%Good Intent Call
- 102.7%Service Call
- 82.1%False Alarm
- 10.3%Severe Weather
- Fire incident types reported to NFIRS in Liberty, IN
- 7644.7%Structure Fires
- 5029.4%Outside Fires
- 4023.5%Mobile Property/Vehicle Fires
- 42.4%Other
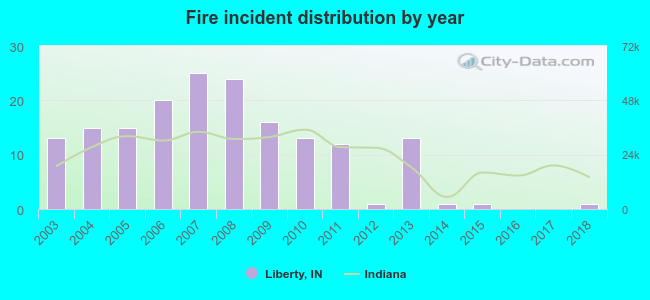 According to the data from the years 2003 - 2018 the average number of fire incidents per year is 11. The highest number of reported fires - 25 took place in 2007, and the least - 0 in 2016. The data has a dropping trend.
 30.0% incidents where reported in the morning and 70.0% in the evening. The most fires (17.6%) took place on Saturday, and the least (12.4%) on Tuesday.
 According to the 170 fire incident reports from years 2003 - 2018 most fires (14.7%) took place during October, and the least (3.5%) in January.
 Out of all 373 cases reported during the years 2003 - 2018, the most belonged to the categories: Fire (45.6%), Rescue & EMS (31.4%), and Overpressure Rupture (12.3%).
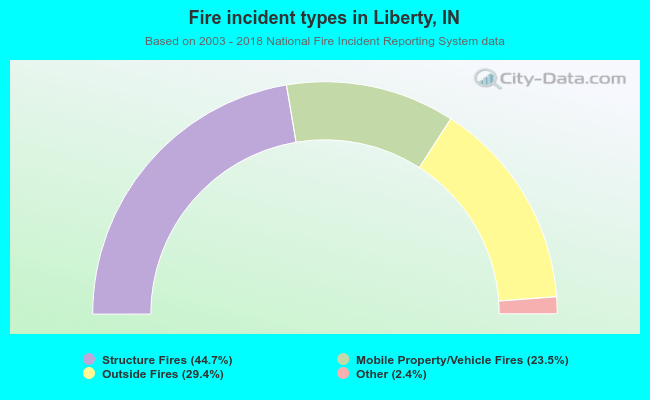 When looking into fire subcategories, the most reports belonged to: Structure Fires (44.7%), and Outside Fires (29.4%).