Liberty: Fire Incidents, South Carolina (SC)
Where are fire incidents reported in Liberty, SC
Something went wrong! Please refresh the page.
|
| |||||||||||||||||||||||||||||||||||||||||||||||||||||||||||||||||||||||||||||||||||||||||||||||||||||||||||||
| Other | 11 | |||||||||||||||||||||||||||||||||||||||||||||||||||||||||||||||||||||||||||||||||||||||||||||||||||||||||||||
2004 - 2018 National Fire Incident Reporting System (NFIRS) incidents
- Incident types reported to NFIRS in Liberty, SC
- 1,06541.1%Fire
- 46217.8%Rescue & EMS
- 45117.4%Hazardous Condition
- 2399.2%Good Intent Call
- 2248.7%Service Call
- 1023.9%False Alarm
- 301.2%Severe Weather
- 100.4%Special Incident
- 60.2%Overpressure Rupture
- Fire incident types reported to NFIRS in Liberty, SC
- 51348.2%Outside Fires
- 33331.3%Structure Fires
- 15914.9%Mobile Property/Vehicle Fires
- 605.6%Other
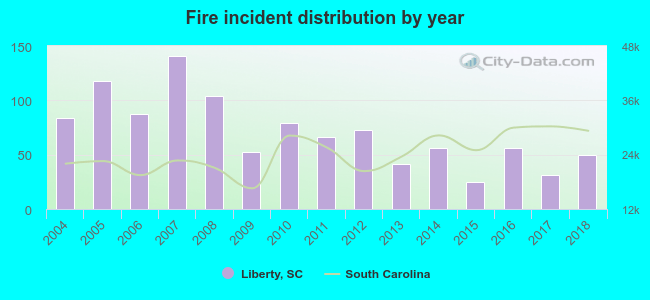 According to the data from the years 2004 - 2018 the average number of fire incidents per year is 71. The highest number of fire incidents - 141 took place in 2007, and the least - 25 in 2015. The data has a dropping trend.
 The median response time based on all reported fire incidents is 6 minutes. This is about the same as the South Carolina median value.
The median response time in Liberty, SC compared to nearest cities:
(Note: Based on data for all years, including only cities with at least 500 fire incidents)
| Liberty: | 6 minutes |
| Easley: | 6 minutes |
| Pickens: | 7 minutes |
| Central: | 6 minutes |
| Six Mile: | 7 minutes |
| Clemson: | 6 minutes |
| Pendleton: | 8 minutes |
| Piedmont: | 6 minutes |
| Seneca: | 8 minutes |
 29.8% incidents where reported in the morning and 70.2% in the evening. The most fires (16.3%) took place on Saturday, and the least (13.3%) on Monday.
 According to the 1,065 fire incidents from years 2004 - 2018 most fires (10.7%) took place during June, and the least (5.8%) in May.
 Out of all 2,589 cases reported during the years 2004 - 2018, the most belonged to the categories: Fire (41.1%), Rescue & EMS (17.8%), and Hazardous Condition (17.4%).
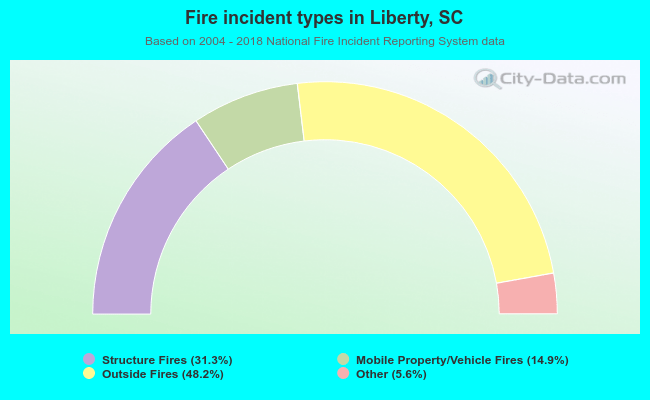 When looking into fire subcategories, the most incidents belonged to: Outside Fires (48.2%), and Structure Fires (31.3%).