| Fire incidents reported |
|---|
| Sreet name | Count |
|---|
| 1100 NORTH & 25 WEST | 4 | | 908 NORTH MAIN STREET | 4 | | PLUM | 4 | | U.S.231 & 1100 NORTH | 4 | | US 231 & 650 NORTH | 4 | | VINE ST | 4 | | 100 EAST 950 NORTH | 2 | | 100 NORTH MAIN STREET | 2 | | 1000 NORTH 500 EAST | 2 | | 1000 NORTH 6628 EAST | 2 | | 1000 NORTH & 150 EAST | 2 | | 1000 NORTH & 275 EAST | 2 | | 1000 NORTH 325 EAST | 2 | | 1000 NORTH&250 EAST | 2 | | 1000 RD | 2 | | 1050 EAST 575 NORTH | 2 | | 107 EAST 700 NORTH | 2 | | 1100 | 2 | | 1100 NORTH & 100 WEST | 2 | | 1100 NORTH & 250 WEST | 2 | | 11065 NORTH 400 WEST | 2 | | 1200 NORTH & 250 EAST | 2 | | 1316 WEST 1100 NORTH | 2 | | 1321 WEST & 1000 NORTH | 2 | | 1876 EAST 1100 NORTH | 2 |
| | | Fire incidents reported |
|---|
| Sreet name | Count |
|---|
| 1935 WEST 1000 NORTH | 2 | | 202 EAST VINE STREET | 2 | | 202 NORTH MAIN STREET | 2 | | 203 WEST WATER STREET | 2 | | 208 NORTH MAIN STREET | 2 | | 208 SOUTH HARRISON STREET | 2 | | 214 NORTH HIGH STREET | 2 | | 215 1/2 HARDING STREET | 2 | | 220 EAST VINE STREET | 2 | | 220 SOUTH HARRISON STREET | 2 | | 220 SOUTH WEST STREET | 2 | | 250 EAST 1150 NORTH | 2 | | 302 EAST VINE STREET | 2 | | 302 NORTH MAIN STREET | 2 | | 303 EAST SOUTH STREET | 2 | | 309 EAST PLUM STREET | 2 | | 321 EAST VINE STREET | 2 | | 3600 EAST 1200 NORTH | 2 | | 385 WEST 580 NORTH | 2 | | 402 WEST WALNUT STREET | 2 | | 409 EAST WATER STREET | 2 | | 4093 EAST 1200 NORTH | 2 | | 4791 EAST 500 NORTH | 2 | | 575 WEST 970 NORTH | 2 | | |
|
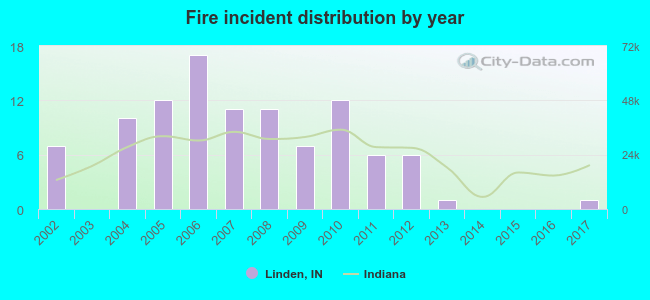 Based on the data from the years 2002 - 2017 the average number of fire incidents per year is 6. The highest number of reported fires - 17 took place in 2006, and the least - 0 in 2003. The data has a dropping trend.
 29.7% incidents where reported in the morning and 70.3% in the evening. The most fires (18.8%) took place on Monday, and the least (10.9%) on Sunday.
 According to the 101 fires from years 2002 - 2017 most fires (13.9%) took place during March, and the least (3.0%) in February.
 Out of all 191 cases reported during the years 2002 - 2017, the most belonged to the categories: Fire (52.9%), Service Call (18.8%), and Rescue & EMS (14.1%).
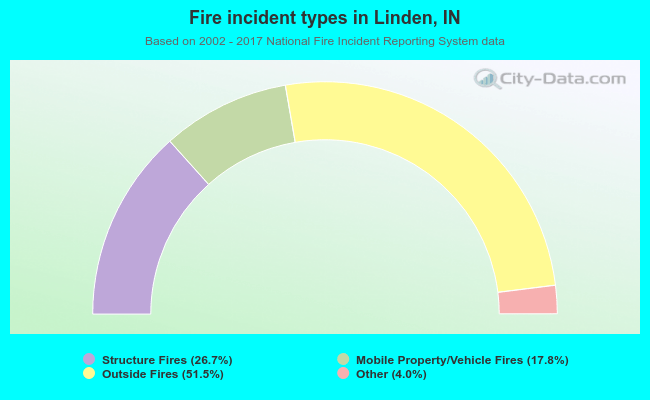 When looking into fire subcategories, the most incidents belonged to: Outside Fires (51.5%), and Structure Fires (26.7%).