| Fire incidents reported |
|---|
| Sreet name | Count |
|---|
| US HWY 6 | 20 | | AIRPORT RD | 14 | | PENN ST | 10 | | ERIE ST | 8 | | 4854 WEST CENTER ROAD | 6 | | LINESVILLE RD | 6 | | MAPLE RD | 6 | | PHELPS RD | 6 | | SHERMANSVILLE RD | 6 | | TOWNLINE RD | 6 | | WHEELER RD | 6 | | WHEELER RD | 6 | | CENTER RD | 4 | | HOMESTEAD AVE | 4 | | HWY 6 | 4 | | JEFFERSON ST | 4 | | MAPLE RD | 4 | | PENN ST | 4 | | PHELPS RD | 4 | | PRIMROSE DR | 4 | | SCHOOL DR | 4 | | US HIGHWAY 6 | 4 | | 1063 LESTER RD | 2 | | 12102 LOIS LANE | 2 | | 12495 SOUTH TOWNLINE RD | 2 |
| | | Fire incidents reported |
|---|
| Sreet name | Count |
|---|
| 127 CONNEAUT STREET | 2 | | 130 WEST SCHOOL DRIVE | 2 | | 13471 BEAGLE ROAD | 2 | | 14948 AIRPORT RD | 2 | | 15097 SHERMANSVILLE RD | 2 | | 15120 PHELPS RD | 2 | | 15883 SHERRETTS RD | 2 | | 2223 US HIGHWAY 6 | 2 | | 2339 LAKEVIEW DR | 2 | | 3170 US HIGHWAY 6 | 2 | | 3972 US HIGHWAY 6 | 2 | | 4209 WHEELER RD | 2 | | 652 FOOTSVILLE RD | 2 | | 9598 GEHRTON ROAD | 2 | | AIRPORT | 2 | | AIRPORT RD | 2 | | AIRPORT RD. | 2 | | CENTER ROAD | 2 | | CHESTNUT ST | 2 | | CONNEAUT ST | 2 | | E ERIE ST | 2 | | FOOTSVILLE RD | 2 | | FOOTSVILLE RICHMOND RD | 2 | | LAKEVIEW DR | 2 | | |
|
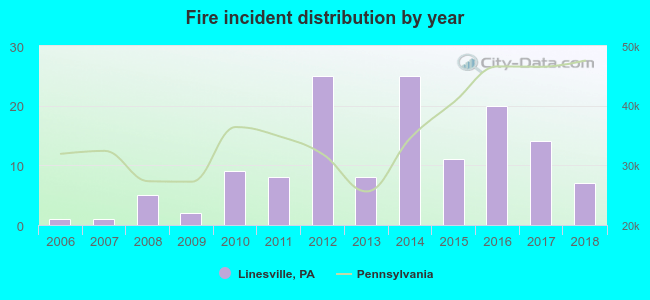 According to the data from the years 2006 - 2018 the average number of fires per year is 10. The highest number of reported fires - 25 took place in 2012, and the least - 1 in 2006. The data has a rising trend.
 22.1% incidents where reported in the morning and 77.9% in the evening. The most fires (19.1%) took place on Tuesday, and the least (8.1%) on Thursday.
 According to the 136 incident reports from years 2006 - 2018 most fires (22.1%) took place during November, and the least (2.2%) in February.
 Out of all 222 cases reported during the years 2006 - 2018, the most belonged to the categories: Fire (61.3%), Rescue & EMS (13.5%), and Service Call (8.6%).
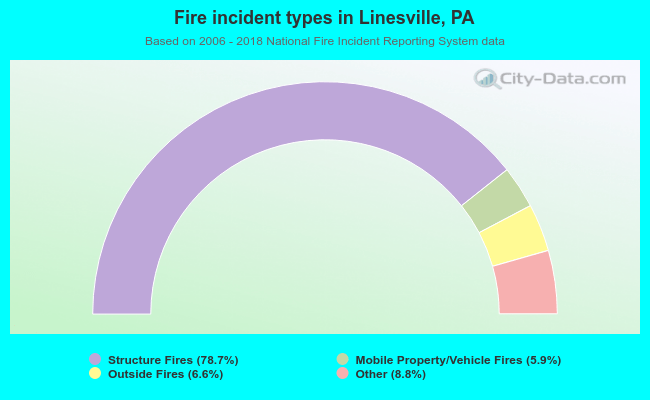 When looking into fire subcategories, the most reports belonged to: Structure Fires (78.7%), and Other (8.8%).