Lingle: Fire Incidents, Wyoming (WY)
Where are fire incidents reported in Lingle, WY
Something went wrong! Please refresh the page.
|
| |||||||||||||||||||||||||||||||||||||||||||||||||||||||||||||||||||||||||||||||||||||||||||||||||||||
2002 - 2018 National Fire Incident Reporting System (NFIRS) incidents
- Incident types reported to NFIRS in Lingle, WY
- 20166.6%Fire
- 7223.8%Good Intent Call
- 124.0%Rescue & EMS
- 93.0%Hazardous Condition
- 41.3%Special Incident
- 31.0%Service Call
- 10.3%False Alarm
- Fire incident types reported to NFIRS in Lingle, WY
- 16280.6%Outside Fires
- 2210.9%Structure Fires
- 168.0%Mobile Property/Vehicle Fires
- 10.5%Other
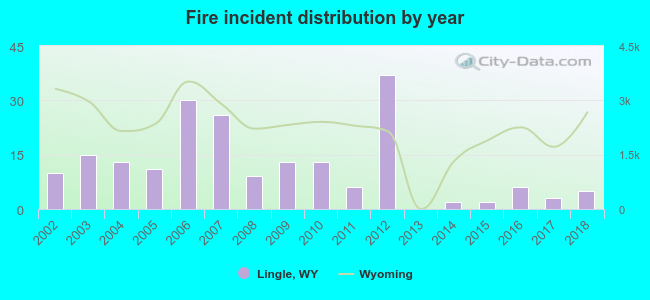 According to the data from the years 2002 - 2018 the average number of fire incidents per year is 12. The highest number of reported fire incidents - 37 took place in 2012, and the least - 0 in 2013. The data has a dropping trend.
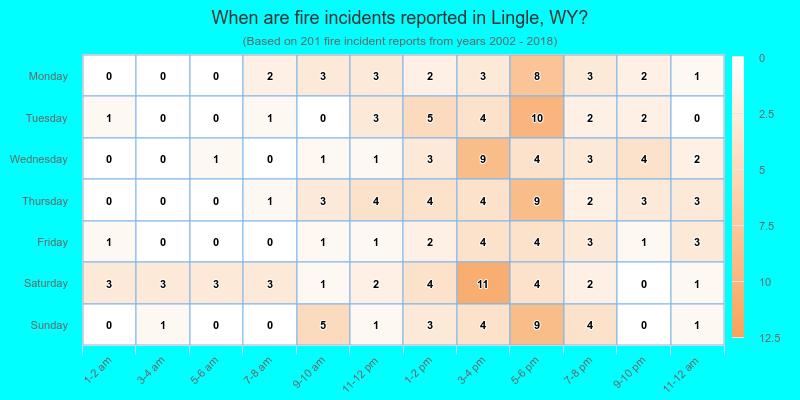
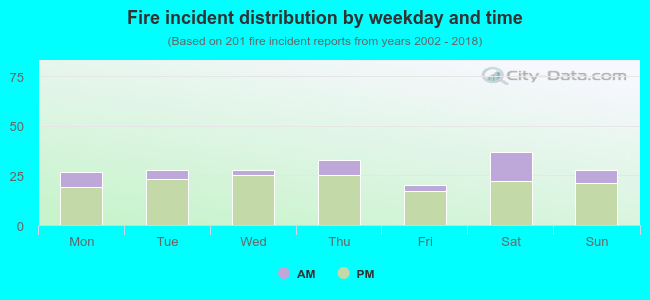 24.4% incidents where reported in the morning and 75.6% in the evening. The most fires (18.4%) took place on Saturday, and the least (10.0%) on Friday.
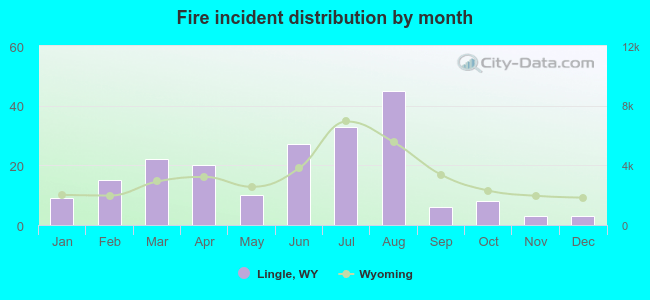 Based on the 201 fire incidents from years 2002 - 2018 most fires (22.4%) took place during August, and the least (1.5%) in November.
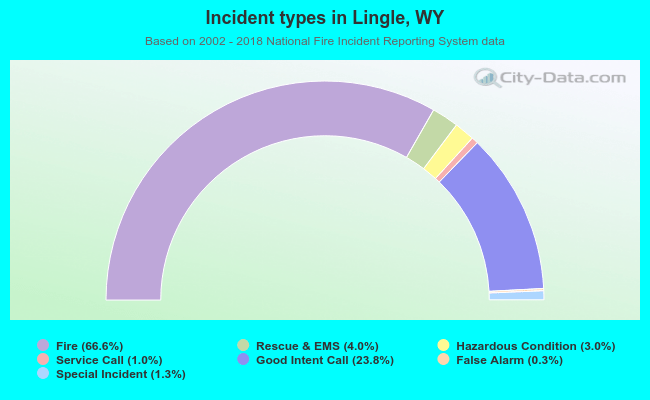 Out of all 302 cases reported during the years 2002 - 2018, the most belonged to the categories: Fire (66.6%), Service Call (23.8%), and Overpressure Rupture (4.0%).
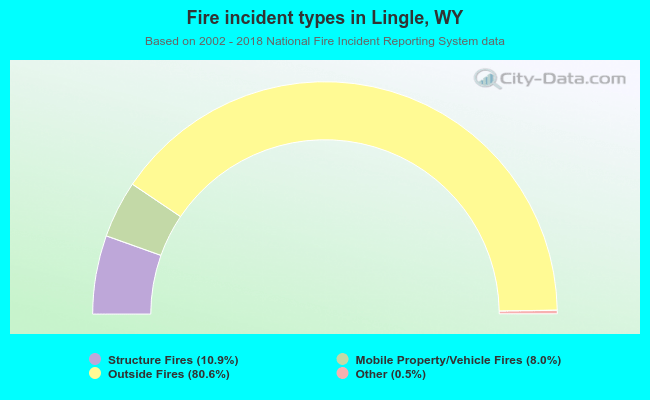 When looking into fire subcategories, the most incidents belonged to: Outside Fires (80.6%), and Structure Fires (10.9%).