| Fire incidents reported |
|---|
| Sreet name | Count |
|---|
| HWY 50 | 12 | | 1644 HWY 50 EAST | 4 | | 1995 HWY 50 E | 4 | | 217 COUNTY RD 301 | 4 | | 50 HWY | 4 | | 63 PROGRESS LANE | 4 | | C HWY | 4 | | HIGHWAY 50 | 4 | | HWY 89 NORTH | 4 | | HWY A | 4 | | HWY C | 4 | | MAIN STREET | 4 | | WOLF RIDGE TRAIL | 4 | | 1 TECHNOLOGY DR | 2 | | 100 MAIN ST ST | 2 | | 1021 CO RD 203 | 2 | | 1021 COUNTY ROAD 203 | 2 | | 1021 E BENTON ST | 2 | | 104 PLUM LANE | 2 | | 105 NORTH KLEBBA DRIVE | 2 | | 108 AUTUM LN | 2 | | 108 CR 400B | 2 | | 108 THE SQUARE | 2 | | 110 MAIN | 2 | | 110 MAIN STREET | 2 |
| | | Fire incidents reported |
|---|
| Sreet name | Count |
|---|
| 110 THE SQUARE | 2 | | 1107 E MAIN | 2 | | 1117 MAIN | 2 | | 121 ROCKY ROAD TRAIL | 2 | | 123 DORWEILER TRL | 2 | | 126 DON LANE | 2 | | 128 CR 321 | 2 | | 1300 E MAIN | 2 | | 1312 E MAIN | 2 | | 139 OCR 305 | 2 | | 140 EAGLE RIDGE TRL | 2 | | 1426 HWY 50 WEST | 2 | | 1441 LIMESTONE LANE | 2 | | 1445 HIGHWAY CC | 2 | | 1549 HWY 50 EAST | 2 | | 1633 HWY 100 | 2 | | 1633 HWY J | 2 | | 164 SERENE TRL | 2 | | 172 CURT AND VAL LN | 2 | | 175 LAKE VIEW TRAIL | 2 | | 179 COUNTY ROAD 802 | 2 | | 179 OCR 802 | 2 | | 1799 HWY 50 EAST | 2 | | 186 HWY 89 S | 2 | | 188 STUMPE LN | 2 |
|
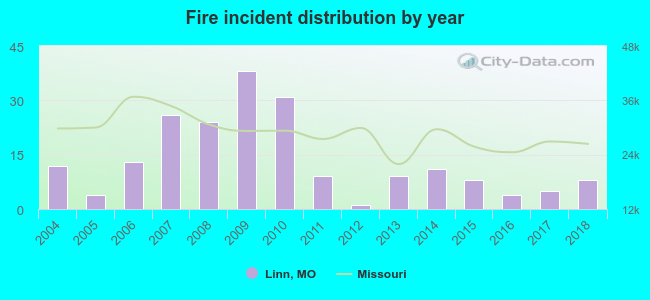 Based on the data from the years 2004 - 2018 the average number of fire incidents per year is 14. The highest number of reported fire incidents - 38 took place in 2009, and the least - 1 in 2012. The data has a decreasing trend.
 35.5% incidents where reported in the morning and 64.5% in the evening. The most fires (17.2%) took place on Sunday, and the least (11.8%) on Monday.
 According to the 203 incident reports from years 2004 - 2018 most fires (19.7%) took place during March, and the least (3.0%) in September.
 Out of all 308 cases reported during the years 2004 - 2018, the most belonged to the categories: Fire (65.9%), Rescue & EMS (22.4%), and Hazardous Condition (10.7%).
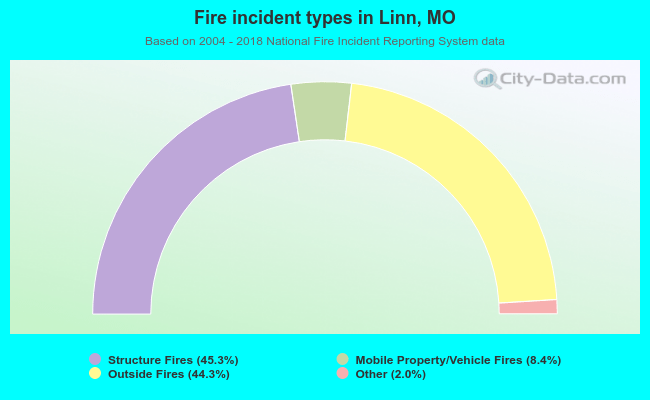 When looking into fire subcategories, the most incidents belonged to: Structure Fires (45.3%), and Outside Fires (44.3%).