Little Hocking: Fire Incidents, Ohio (OH)
Where are fire incidents reported in Little Hocking, OH
Something went wrong! Please refresh the page.
|
| |||||||||||||||||||||||||||||||||||||||||||||||||||||||||||||||||||||||||||||||||||||||||||||||||||||||||||||
2002 - 2018 National Fire Incident Reporting System (NFIRS) incidents
- Incident types reported to NFIRS in Little Hocking, OH
- 24540.9%Fire
- 14023.4%Rescue & EMS
- 13923.2%Hazardous Condition
- 203.3%Severe Weather
- 172.8%Service Call
- 172.8%False Alarm
- 152.5%Good Intent Call
- 50.8%Special Incident
- 10.2%Overpressure Rupture
- Fire incident types reported to NFIRS in Little Hocking, OH
- 9237.6%Structure Fires
- 9237.6%Outside Fires
- 5723.3%Mobile Property/Vehicle Fires
- 41.6%Other
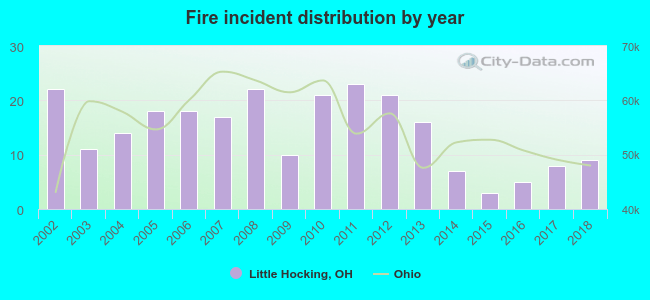 According to the data from the years 2002 - 2018 the average number of fires per year is 14. The highest number of fire incidents - 23 took place in 2011, and the least - 3 in 2015. The data has a dropping trend.
 22.9% incidents where reported in the morning and 77.1% in the evening. The most fires (16.7%) took place on Saturday, and the least (9.8%) on Sunday.
 According to the 245 fire incidents from years 2002 - 2018 most fires (11.8%) took place during April, and the least (5.3%) in August.
 Out of all 599 cases reported during the years 2002 - 2018, the most belonged to the categories: Fire (40.9%), Rescue & EMS (23.4%), and Hazardous Condition (23.2%).
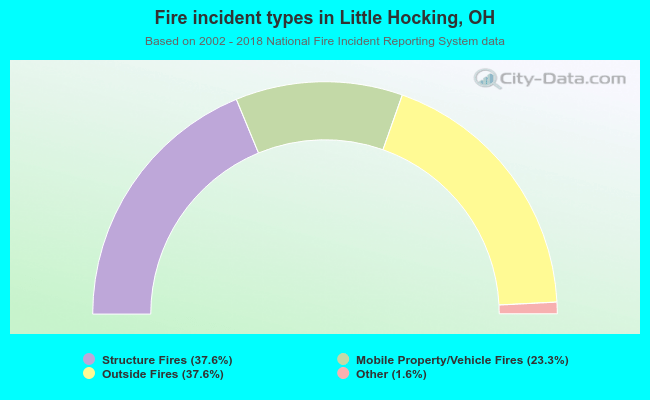 When looking into fire subcategories, the most incidents belonged to: Structure Fires (37.6%), and Outside Fires (37.6%).