Littlefield: Fire Incidents, Texas (TX)
Where are fire incidents reported in Littlefield, TX
Something went wrong! Please refresh the page.
|
| |||||||||||||||||||||||||||||||||||||||||||||||||||||||||||||||||||||||||||||||||||||||||||||||||||||||||||||
| Other | 418 | |||||||||||||||||||||||||||||||||||||||||||||||||||||||||||||||||||||||||||||||||||||||||||||||||||||||||||||
2002 - 2018 National Fire Incident Reporting System (NFIRS) incidents
- Incident types reported to NFIRS in Littlefield, TX
- 1,26678.3%Fire
- 1026.3%Hazardous Condition
- 815.0%Rescue & EMS
- 633.9%Good Intent Call
- 442.7%False Alarm
- 432.7%Service Call
- 130.8%Special Incident
- 30.2%Severe Weather
- Fire incident types reported to NFIRS in Littlefield, TX
- 83365.8%Outside Fires
- 25320.0%Structure Fires
- 13410.6%Mobile Property/Vehicle Fires
- 463.6%Other
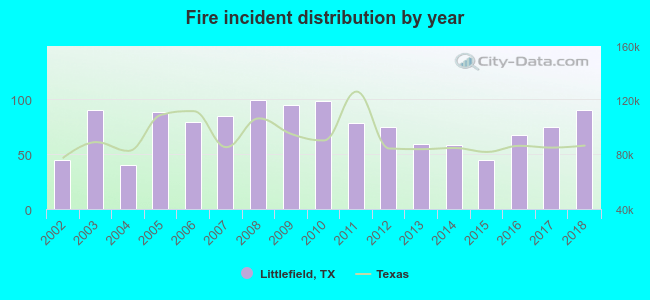 According to the data from the years 2002 - 2018 the average number of fire incidents per year is 74. The highest number of fires - 99 took place in 2008, and the least - 40 in 2004. The data has a growing trend.
The average number of yearly fire incidents per 10k residents in Littlefield, TX compared to nearest cities:
(Note: Based on data for the last 3 years, including only cities with population 5,000 and above)
| Littlefield: | 125.1 |
| Levelland: | 85.5 |
| Lubbock: | 35.6 |
| Plainview: | 59.5 |
| Brownfield: | 72.7 |
| Slaton: | 57.1 |
| Hereford: | 93.8 |
| Canyon: | 87.8 |
| Lamesa: | 108.8 |
 The median response time based on all reported fire incidents is 9 minutes. This is higher than the Texas median value.
The median response time in Littlefield, TX compared to nearest cities:
(Note: Based on data for all years, including only cities with at least 500 fire incidents)
| Littlefield: | 9 minutes |
| Levelland: | 7 minutes |
| Shallowater: | 10 minutes |
| Muleshoe: | 12 minutes |
| Lubbock: | 5 minutes |
| Plainview: | 5 minutes |
| Brownfield: | 6 minutes |
| Slaton: | 5 minutes |
| Tulia: | 9 minutes |
 According to the data from the years 2002 - 2018 the average number of fire-related fatalities per year is 0. The highest number of deaths - 4 took place in 2009, and the lowest - 0 in 2002. The data has a constant trend.
 23.1% incidents where reported in the morning and 76.9% in the evening. The most fires (16.7%) took place on Monday, and the least (12.4%) on Friday.
 Based on the 1,266 fire incidents from years 2002 - 2018 most fires (11.0%) took place during March, and the least (4.6%) in October.
 Out of all 1,616 cases reported during the years 2002 - 2018, the most belonged to the categories: Fire (78.3%), Hazardous Condition (6.3%), and Rescue & EMS (5.0%).
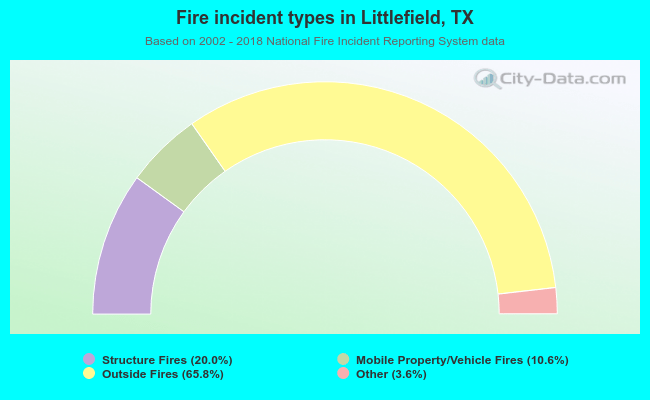 When looking into fire subcategories, the most incidents belonged to: Outside Fires (65.8%), and Structure Fires (20.0%).