Live Oak: Fire Incidents, Texas (TX)
Where are fire incidents reported in Live Oak, TX
Something went wrong! Please refresh the page.
|
| |||||||||||||||||||||||||||||||||||||||||||||||||||||||||||||||||||||||||||||||||||||||||||||||||||||||||||||
2002 - 2018 National Fire Incident Reporting System (NFIRS) incidents
- Incident types reported to NFIRS in Live Oak, TX
- 1,11658.7%Rescue & EMS
- 22912.0%Fire
- 1588.3%Hazardous Condition
- 1568.2%Good Intent Call
- 1226.4%False Alarm
- 1166.1%Service Call
- 20.1%Overpressure Rupture
- 20.1%Severe Weather
- Fire incident types reported to NFIRS in Live Oak, TX
- 11349.3%Structure Fires
- 5122.3%Outside Fires
- 4720.5%Mobile Property/Vehicle Fires
- 187.9%Other
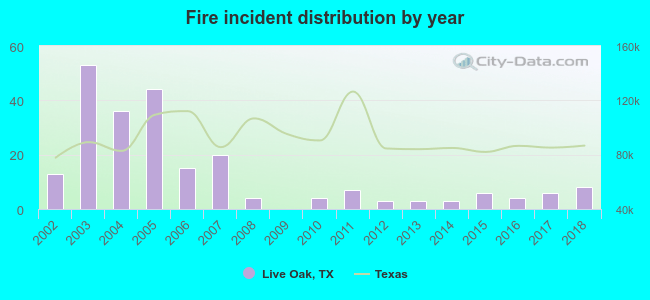 According to the data from the years 2002 - 2018 the average number of fire incidents per year is 13. The highest number of fires - 53 took place in 2003, and the least - 0 in 2009. The data has a dropping trend.
The average number of yearly fire incidents per 10k residents in Live Oak, TX compared to nearest cities:
(Note: Based on data for the last 3 years, including only cities with population 5,000 and above)
| Live Oak: | 4.0 |
| Universal City: | 28.7 |
| Converse: | 21.2 |
| Selma: | 31.4 |
| Windcrest: | 17.5 |
| Schertz: | 32.5 |
| Cibolo: | 29.5 |
| Kirby: | 30.8 |
| Terrell Hills: | 7.7 |
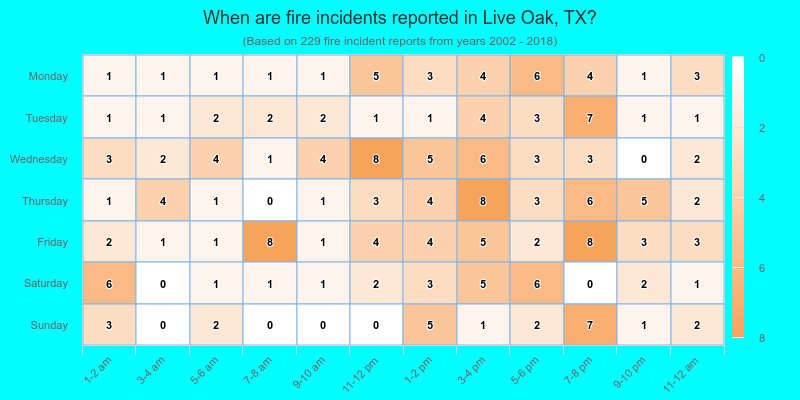
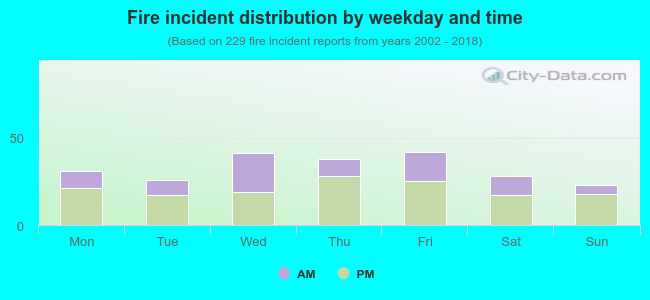 36.7% incidents where reported in the morning and 63.3% in the evening. The most fires (18.3%) took place on Friday, and the least (10.0%) on Sunday.
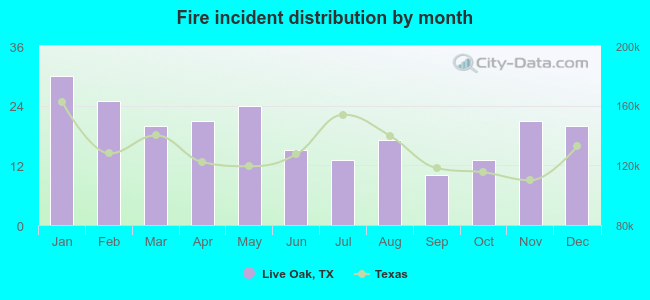 According to the 229 reports from years 2002 - 2018 most fires (13.1%) took place during January, and the least (4.4%) in September.
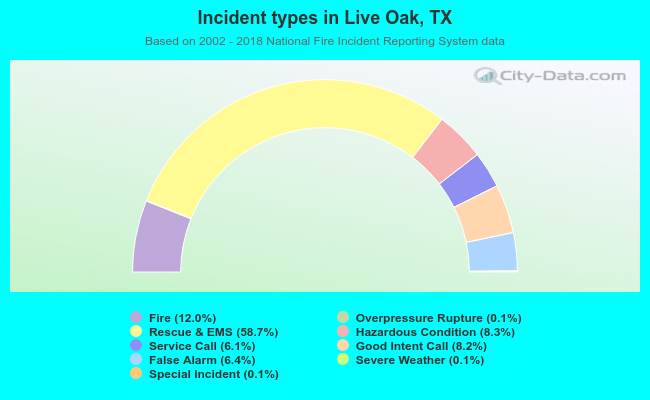 Out of all 1,902 cases reported during the years 2002 - 2018, the most belonged to the categories: Rescue & EMS (58.7%), Fire (12.0%), and Hazardous Condition (8.3%).
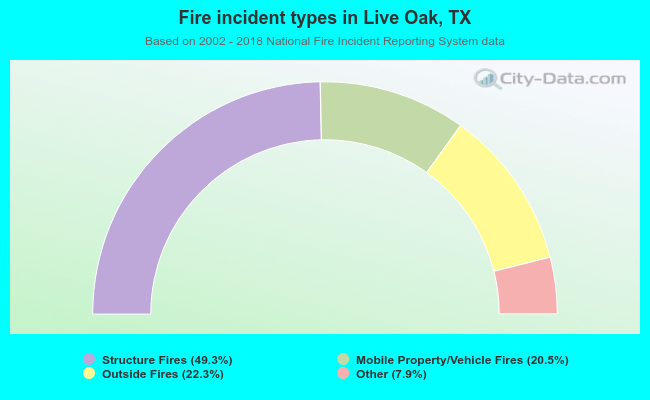 When looking into fire subcategories, the most reports belonged to: Structure Fires (49.3%), and Outside Fires (22.3%).