| Fire incidents reported |
|---|
| Sreet name | Count |
|---|
| HUNTERS VALLEY RD | 16 | | MARKET ST | 12 | | SUSQUEHANNA BUTW TRL | 12 | | FRONT ST | 8 | | KLINGER HOLLOW RD | 8 | | PERRY VALLEY RD | 8 | | RT 17 RT | 8 | | WINDY HILL RD | 8 | | CHERRY RD | 6 | | HILLTOP RD | 6 | | HUNTERS VALLEY ROAD RD | 6 | | BUCKS VALLEY RD | 4 | | GAMBY HILL RD | 4 | | LAUVER HILL RD | 4 | | LEBKICHLER LN | 4 | | OLD FERRY RD | 4 | | OLD FERRY ROAD RD | 4 | | OLD TRAIL LITW RD | 4 | | RED BRIDGE RD | 4 | | RIDGE RD | 4 | | SMITH RD | 4 | | SUSQUEHANNA LIBO TRL | 4 | | SUSQUEHANNA LITW TRL | 4 | | SUSQUEHANNA TRAIL RD | 4 | | TURKEY VALLEY RD | 4 |
| | | Fire incidents reported |
|---|
| Sreet name | Count |
|---|
| BARNERS CHURCH RD | 2 | | BARNERS RD | 2 | | BIXLER LN | 2 | | BREEZY HILL LN | 2 | | BUCKS CHURCH RD | 2 | | BUCKS VALLEY ROAD RD | 2 | | BYERS RD | 2 | | CAMBRIDGE CIR | 2 | | CENTER RD | 2 | | CENTER ROAD RD | 2 | | CHERRY ROAD RD | 2 | | CHUBB HOLLOW RD | 2 | | DAVIDSON RD | 2 | | DEMOCRATIC LN | 2 | | DEMOCRATIC LN RD | 2 | | FISHING ROD RD | 2 | | HILL TOP RD | 2 | | HUNTERS CHURCH RD | 2 | | HUNTERS VALLEY ROADRT3 | 2 | | KLINGER HOLLOW RD | 2 | | LEININERS RUN RD | 2 | | LENNINGER RUN ROAD | 2 | | LENNINGERS RUN RD | 2 | | LIMEKILN RD | 2 | | |
|
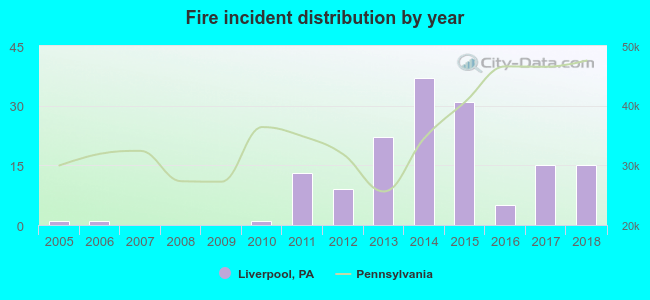 According to the data from the years 2005 - 2018 the average number of fires per year is 11. The highest number of reported fires - 37 took place in 2014, and the least - 0 in 2007. The data has a rising trend.
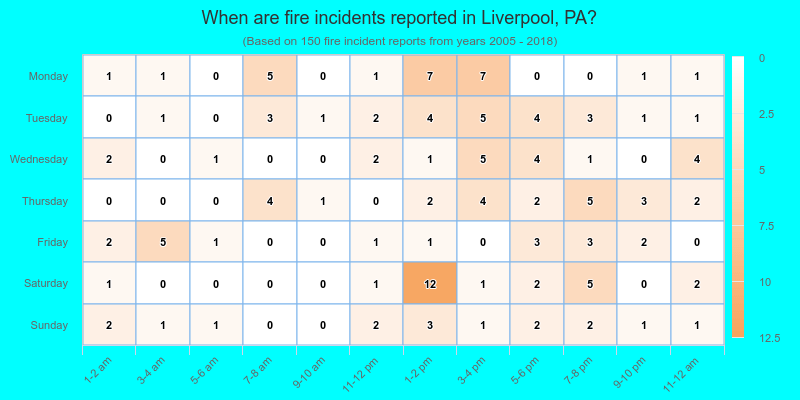
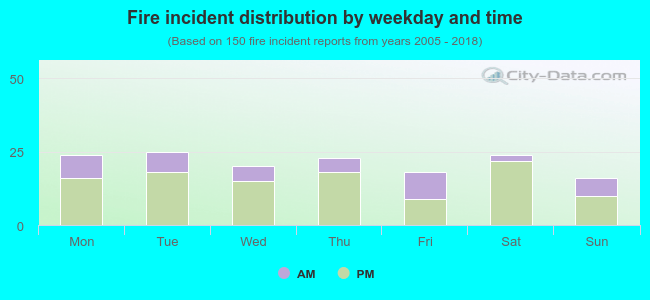 28.0% incidents where reported in the morning and 72.0% in the evening. The most fires (16.7%) took place on Tuesday, and the least (10.7%) on Sunday.
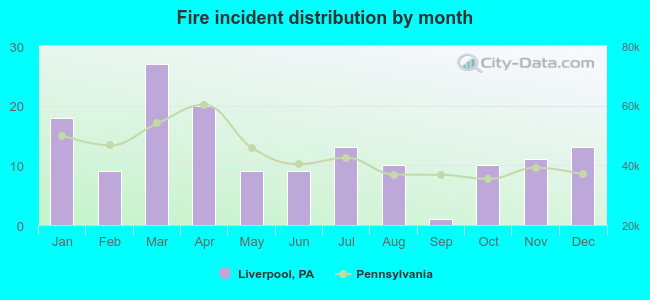 According to the 150 incident reports from years 2005 - 2018 most fires (18.0%) took place during March, and the least (0.7%) in September.
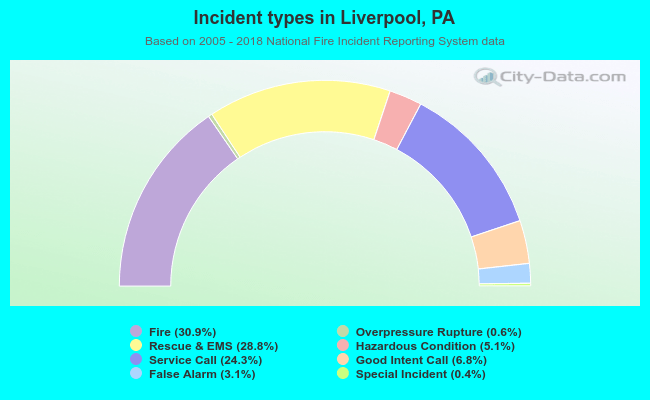 Out of all 486 cases reported during the years 2005 - 2018, the most belonged to the categories: Fire (30.9%), Rescue & EMS (28.8%), and Service Call (24.3%).
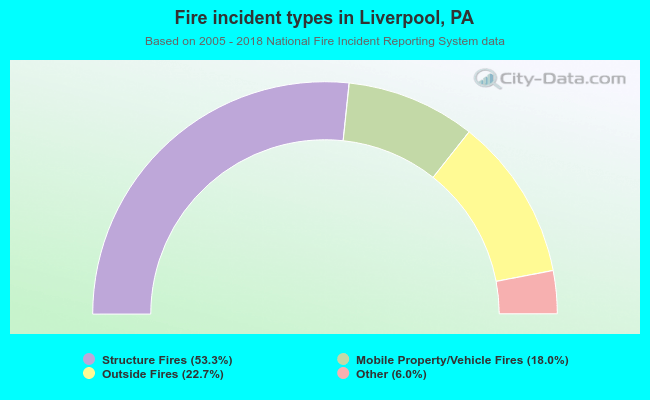 When looking into fire subcategories, the most reports belonged to: Structure Fires (53.3%), and Outside Fires (22.7%).