| Fire incidents reported |
|---|
| Sreet name | Count |
|---|
| SAND HILL RD | 80 | | RED HILL RD | 50 | | MAIN ST | 26 | | UPPER RIVER RD | 22 | | LOWER RIVER RD | 20 | | WILDERNESS RD | 18 | | TRACE BRANCH RD | 16 | | PINNY BRANCH RD | 14 | | BIG CAVE RD | 10 | | CALLOWAY BRANCH RD | 10 | | RED HILL RD | 10 | | S. WILDERNESS RD | 10 | | SAND HILL RD | 8 | | SANDHILL RD | 8 | | EMBER RD | 6 | | FORD HOLLOW RD | 6 | | FORD HOLLOW RD | 6 | | MAHAFFEY HILL RD | 6 | | MAIN STRE | 6 | | MCCLURE ST | 6 | | MCCLURE STR | 6 | | RED HILL | 6 | | S WILDERNESS RD | 6 | | TEN FOOT HOLE RD | 6 | | BLACKBURN LANE | 4 |
| | | Fire incidents reported |
|---|
| Sreet name | Count |
|---|
| CUT GAP | 4 | | FORT HOLLOW RD | 4 | | FOXGLOVE HILL RD | 4 | | JEPP HILL RD | 4 | | LOWER RIVER RD | 4 | | MAIN STR | 4 | | MAIN STREET | 4 | | OLD GAULEY RD | 4 | | PINNY BRANCH RD | 4 | | RED HILL CEM RD | 4 | | S UPPER RIVER RD | 4 | | TOWHEE LN | 4 | | WHITE STAR RD | 4 | | WILDRESS RD | 4 | | BIG CAVE | 2 | | BIRCH HOLLOW | 2 | | BLACK BEAR LICK LANE | 2 | | BLACK ST | 2 | | BLACKBURN LAN | 2 | | BLACKBURN LN | 2 | | BROWNING CEM RD | 2 | | CARNATION CEM RD | 2 | | CARNATION LN | 2 | | CROOKED CREEK RD | 2 | | CROOKED CREEK RD LGTS | 2 |
|
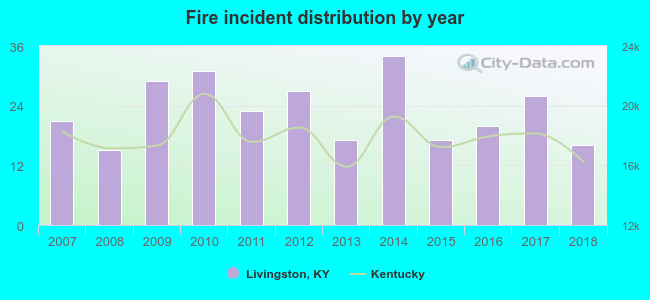 Based on the data from the years 2007 - 2018 the average number of fire incidents per year is 23. The highest number of reported fires - 34 took place in 2014, and the least - 15 in 2008. The data has a dropping trend.
 24.3% incidents where reported in the morning and 75.7% in the evening. The most fires (21.4%) took place on Sunday, and the least (7.6%) on Tuesday.
 Based on the 276 reports from years 2007 - 2018 most fires (23.2%) took place during April, and the least (4.0%) in July.
 Out of all 408 cases reported during the years 2007 - 2018, the most belonged to the categories: Fire (67.6%), Rescue & EMS (15.2%), and Service Call (6.9%).
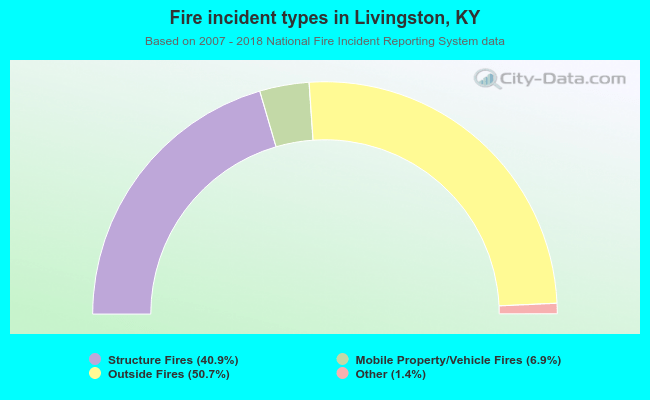 When looking into fire subcategories, the most incidents belonged to: Outside Fires (50.7%), and Structure Fires (40.9%).