| Fire incidents reported |
|---|
| Sreet name | Count |
|---|
| US 190AIRLINE HWY | 32 | | HWY 77 | 12 | | LA 78 RD | 10 | | HWY 78 | 8 | | AIRLINE HWY | 6 | | US 190 HWY | 6 | | AIRLINE HWY | 4 | | DAVID ST | 4 | | DAVID ST | 4 | | FORDOCHE ROADLA 77 NOR RD | 4 | | FORDOCHE ROAD LA 77 RD | 4 | | GLASER ST | 4 | | HWY 190 HWY | 4 | | HWY 411 | 4 | | LA 77 MARINGOUIN RD WEST RD | 4 | | MARINGOUIN RD WEST(LA77) RD | 4 | | NORWOOD ST | 4 | | PARLANGE LN | 4 | | VALVERDA ROAD LA 977 HWY | 4 | | 190 HWY | 2 | | 77 HWY | 2 | | BERGERON ST | 2 | | BERTHIER ST | 2 | | BMG DR | 2 | | CALICOT RD | 2 |
| | | Fire incidents reported |
|---|
| Sreet name | Count |
|---|
| CHAUVIN LN | 2 | | CLOVIS | 2 | | ELTON ST | 2 | | FONTAINE RD | 2 | | FORDOCHE (LA 77 NORTH) RD | 2 | | FRENEAUX ST | 2 | | GLASER STREET | 2 | | HIGH POINT RD | 2 | | HWY 190 | 2 | | HWY 78 PARLANGE LN RD | 2 | | HWY 78 PCFD 4 TRAINING | 2 | | JB LEFEAUX RD | 2 | | LA 81 EAST HWY | 2 | | LA HWY 77 | 2 | | LA HYW 78 | 2 | | LEBEAU ST | 2 | | MARINGOUIN ROAD WEST | 2 | | MARINGOUIN ROAD WEST RD | 2 | | MARY LOUISE ST | 2 | | MONICA ST | 2 | | NEWFIELD DR | 2 | | NEWFIELD DR | 2 | | OKELOUSAS ST | 2 | | PATTERSON ST | 2 | | |
|
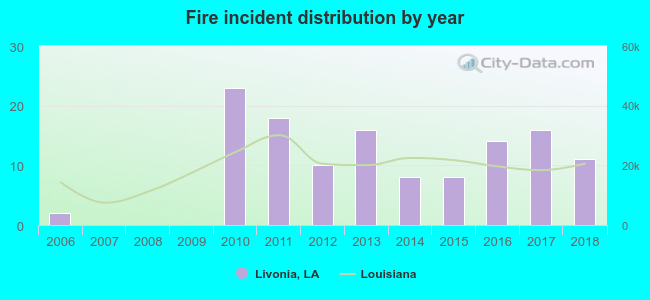 Based on the data from the years 2006 - 2018 the average number of fires per year is 10. The highest number of reported fire incidents - 23 took place in 2010, and the least - 0 in 2007. The data has an increasing trend.
 30.2% incidents where reported in the morning and 69.8% in the evening. The most fires (18.3%) took place on Sunday, and the least (11.1%) on Saturday.
 According to the 126 incident reports from years 2006 - 2018 most fires (11.9%) took place during May, and the least (4.0%) in February.
 Out of all 855 cases reported during the years 2006 - 2018, the most belonged to the categories: Rescue & EMS (64.3%), Fire (14.7%), and Hazardous Condition (6.2%).
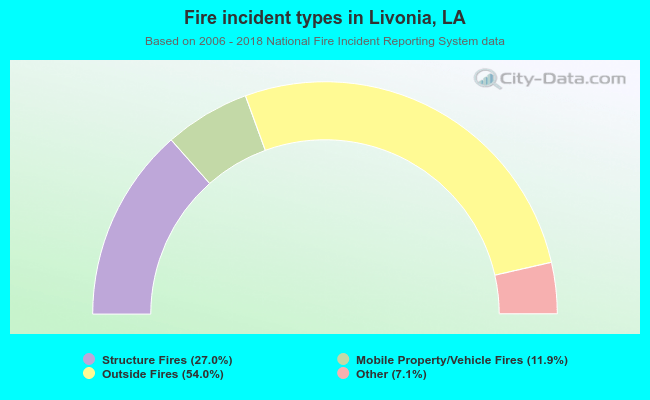 When looking into fire subcategories, the most incidents belonged to: Outside Fires (54.0%), and Structure Fires (27.0%).