| Fire incidents reported |
|---|
| Sreet name | Count |
|---|
| LAKE RD | 32 | | COMMERCIAL ST | 26 | | EAST LAKE ROAD | 26 | | STONE HILL RD | 20 | | BIG TREE RD | 18 | | EAST LAKE RD | 16 | | FEDERAL RD | 16 | | MAIN ST | 16 | | RICHMOND MILLS RD | 16 | | BIG TREE ST | 14 | | DECKER RD | 14 | | COMMERCIAL ST | 12 | | POPLAR HILL RD | 12 | | BIG TREE RD | 10 | | CLEARY RD | 10 | | SOUTH LIVONIA ROAD | 10 | | STATE HIGHWAY 15 | 10 | | COY RD | 8 | | LIVONIA RD | 8 | | PLANK RD | 8 | | RICHMOND MILLS RD | 8 | | S LIVONIA RD | 8 | | COE RD | 6 | | E LAKE RD | 6 | | HARDER RD | 6 |
| | | Fire incidents reported |
|---|
| Sreet name | Count |
|---|
| LAKE GLEN DRIVE | 6 | | LIMA RD | 6 | | LIVONIA CENTER RD | 6 | | MCPHERSONS PT | 6 | | POPLAR HILL RD | 6 | | POPLAR HILL ROAD | 6 | | SOUTH LIVONIA RD | 6 | | STONE HILL RD | 6 | | WILKINS TRACT | 6 | | 4483 PENNEMITE RD | 4 | | BIG TREE ROAD | 4 | | BIG TREE STREET | 4 | | CADYVILLE RD | 4 | | CAMP RUN DR | 4 | | CLEARY ROAD | 4 | | COMMERCIAL STREET | 4 | | COY ROAD | 4 | | DECKER ROAD | 4 | | EAST AVE | 4 | | EAST LAKE RD | 4 | | GARDEN ST | 4 | | LINDEN ST | 4 | | LIVONIA CENTER RD | 4 | | LIVONIA STATION | 4 | | LIVONIA STATION RD | 4 |
|
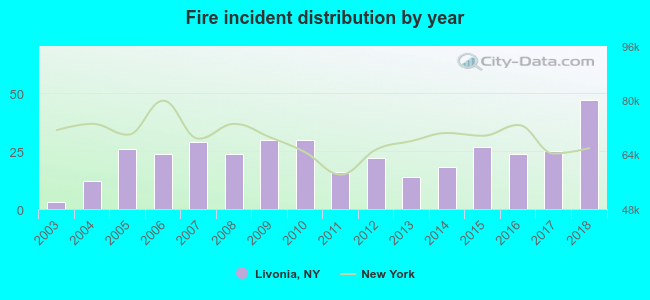 According to the data from the years 2003 - 2018 the average number of fire incidents per year is 23. The highest number of reported fire incidents - 47 took place in 2018, and the least - 3 in 2003. The data has a rising trend.
 27.7% incidents where reported in the morning and 72.3% in the evening. The most fires (21.5%) took place on Saturday, and the least (10.2%) on Tuesday.
 Based on the 372 incident reports from years 2003 - 2018 most fires (17.2%) took place during April, and the least (3.2%) in September.
 Out of all 2,409 cases reported during the years 2003 - 2018, the most belonged to the categories: Good Intent Call (31.1%), Hazardous Condition (20.0%), and Rescue & EMS (18.9%).
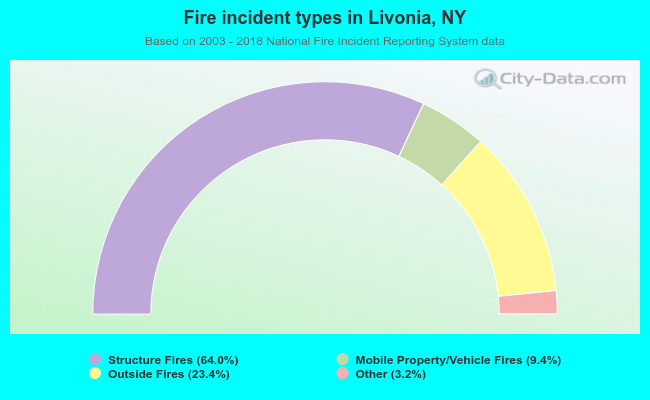 When looking into fire subcategories, the most reports belonged to: Structure Fires (64.0%), and Outside Fires (23.4%).