| Fire incidents reported |
|---|
| Sreet name | Count |
|---|
| BAYVILLE ROAD | 16 | | HORSE HOLLOW ROAD | 10 | | BUCKRAM RD | 8 | | ELM STREET | 8 | | FOREST AVENUE | 8 | | CEDAR AVENUE | 6 | | CHICKEN VALLEY ROAD | 6 | | FOREST AVE | 6 | | PEACOCK LANE | 6 | | PIPING ROCK ROAD | 6 | | 11TH STREET | 4 | | 13TH STREET | 4 | | BUCKRAM RD | 4 | | CHESTER STREET | 4 | | DAVIS STREET | 4 | | DUCK POND ROAD | 4 | | FROST CREEK DRIVE | 4 | | LATTINGTOWN ROAD | 4 | | LATTINGTOWN ROADEXTENSION | 4 | | OAK NECK BEACH ROAD | 4 | | PERSHING AVENUE | 4 | | S. 6TH STREET | 4 | | SOUTH 6TH STREET | 4 | | THE KNOLLS | 4 | | TONDAN LANE | 4 |
| | | Fire incidents reported |
|---|
| Sreet name | Count |
|---|
| UNDERHILL ROAD | 4 | | WEIR LANE | 4 | | WELLINGTON ROAD | 4 | | WOOD LANE | 4 | | WOODS ROAD | 4 | | 10TH ST | 2 | | 10TH STEET | 2 | | 10TH STREET | 2 | | 14TH ST | 2 | | 20 COCKS LANE | 2 | | 250 YARD DRIVE | 2 | | 2ND AVE | 2 | | 2ND AVENUE | 2 | | ANDREW PLACE | 2 | | BALDWIN AVENUE | 2 | | BIRCH HILL ROAD | 2 | | COCKS LANE | 2 | | CROSS STREET | 2 | | DANTON LN S | 2 | | DOGWOOD LANE | 2 | | DUCK POND RD | 2 | | EYRE LANE | 2 | | FACTORY POND ROAD | 2 | | FOREST AVE | 2 | | FOX LANE | 2 |
|
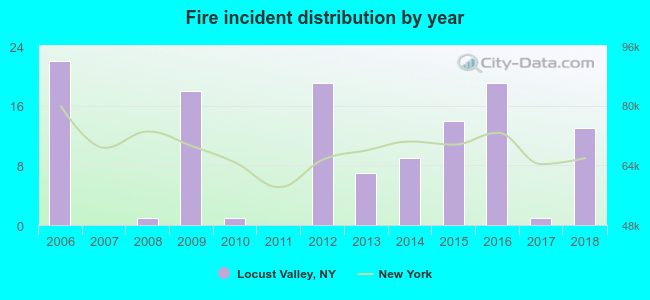 According to the data from the years 2006 - 2018 the average number of fire incidents per year is 10. The highest number of reported fire incidents - 22 took place in 2006, and the least - 0 in 2007. The data has a declining trend.
 33.9% incidents where reported in the morning and 66.1% in the evening. The most fires (20.2%) took place on Sunday, and the least (7.3%) on Wednesday.
 Based on the 124 incident reports from years 2006 - 2018 most fires (16.9%) took place during April, and the least (3.2%) in May.
 Out of all 1,812 cases reported during the years 2006 - 2018, the most belonged to the categories: Rescue & EMS (43.0%), False Alarm (26.2%), and Hazardous Condition (16.2%).
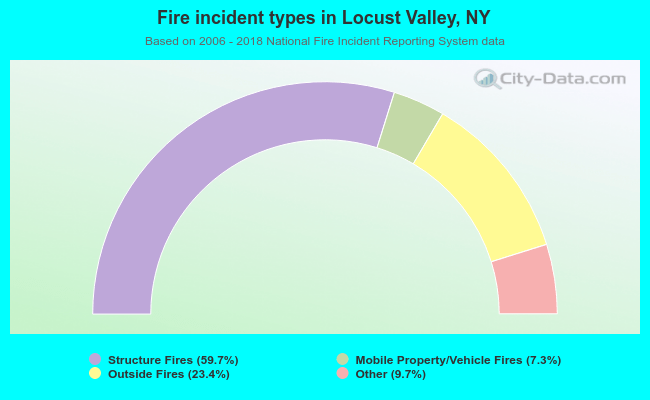 When looking into fire subcategories, the most reports belonged to: Structure Fires (59.7%), and Outside Fires (23.4%).