| Fire incidents reported |
|---|
| Sreet name | Count |
|---|
| VALLEY RD | 56 | | ROCKEY RD | 18 | | WINTER RD | 18 | | EB I80 | 14 | | INTERSTATE 80 HWY | 12 | | MILL ST | 12 | | CLINTON STATION 13 | 10 | | WATER ST | 10 | | MAIN ST | 8 | | NARROWS RD | 6 | | VALLEY ROAD | 6 | | ANTHONY ST | 4 | | CAMPGROUND RD | 4 | | I 80 MM 193 WB | 4 | | PINE LOGANTON RD | 4 | | STOLTZFUS LN | 4 | | WB I-80 | 4 | | WB I80 | 4 | | WEST VALLEY RD | 4 | | 1310ROCKVILLE ROAD | 2 | | 1316 WINTER ROAD | 2 | | 180 MILL ST. | 2 | | 180 SOUTH MILL STREET | 2 | | 185 WEST ON RAMP I 80 | 2 | | 196 HUNTERS KNOLL LANE | 2 |
| | | Fire incidents reported |
|---|
| Sreet name | Count |
|---|
| 4803 LONG RUN ROAD | 2 | | 68 MILL SEAR LANE | 2 | | 725 RAUCHTOWN ROAD | 2 | | 860 WEST VALLEY ROAD | 2 | | 87 LAPP LN | 2 | | ANTHONY | 2 | | BRUSH VALLEY RD | 2 | | BULL RUN RD | 2 | | CAMP GROUND ROAD | 2 | | EAGLE VALLEY RD | 2 | | EB I-80 | 2 | | HARTER MILLS TRL | 2 | | HIDDEN DR | 2 | | HOPPLE HOLLOW RD | 2 | | I 80 MM 183 EAST | 2 | | I 80 MM 185 | 2 | | I 80 MM183 EAST | 2 | | I 80 WB REST AREA | 2 | | I-80 | 2 | | I80 EAST 186MM | 2 | | INTERSTATE 80 | 2 | | LONG RUN RD | 2 | | MEADOW LN | 2 | | NARROWS ROAD | 2 | | |
|
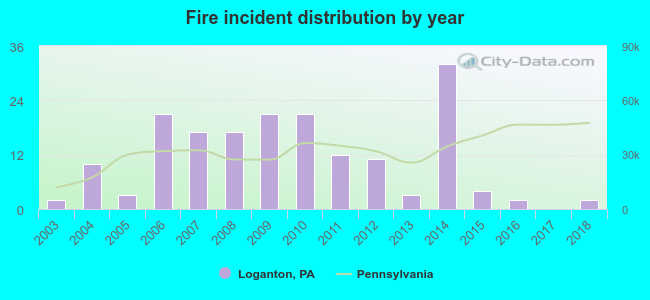 According to the data from the years 2003 - 2018 the average number of fires per year is 11. The highest number of reported fires - 32 took place in 2014, and the least - 0 in 2017. The data has a constant trend.
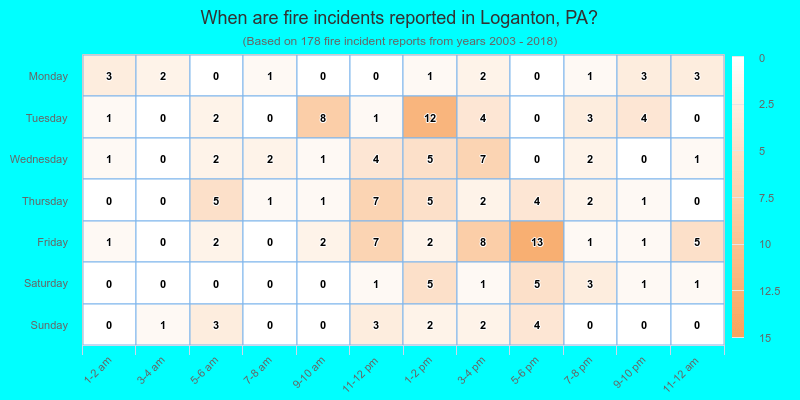
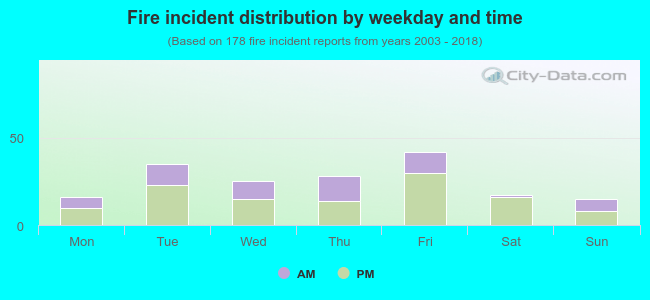 34.8% incidents where reported in the morning and 65.2% in the evening. The most fires (23.6%) took place on Friday, and the least (8.4%) on Sunday.
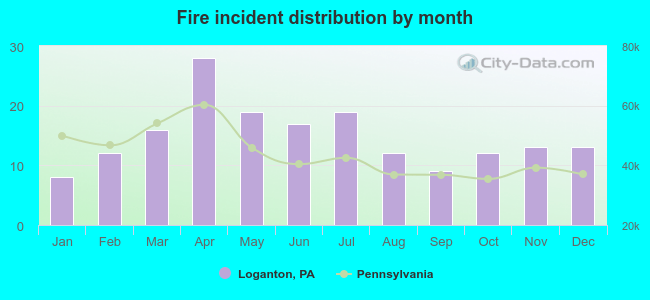 Based on the 178 incident reports from years 2003 - 2018 most fires (15.7%) took place during April, and the least (4.5%) in January.
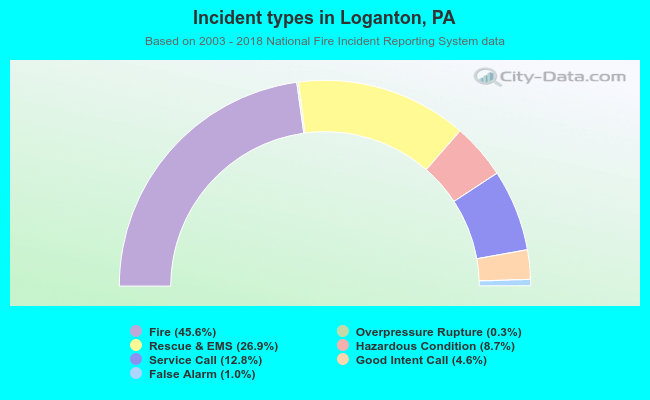 Out of all 390 cases reported during the years 2003 - 2018, the most belonged to the categories: Fire (45.6%), Rescue & EMS (26.9%), and Service Call (12.8%).
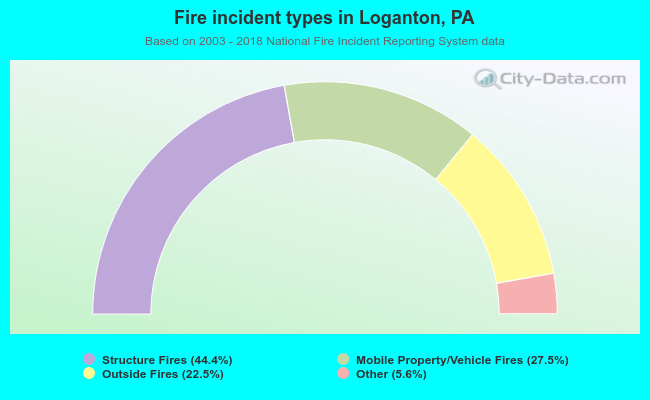 When looking into fire subcategories, the most reports belonged to: Structure Fires (44.4%), and Mobile Property/Vehicle Fires (27.5%).