Lone Jack: Fire Incidents, Missouri (MO)
Where are fire incidents reported in Lone Jack, MO
Something went wrong! Please refresh the page.
|
| |||||||||||||||||||||||||||||||||||||||||||||||||||||||||||||||||||||||||||||||||||||||||||||||||||||||||||||
2002 - 2018 National Fire Incident Reporting System (NFIRS) incidents
- Incident types reported to NFIRS in Lone Jack, MO
- 59947.5%Rescue & EMS
- 29723.5%Fire
- 13810.9%Good Intent Call
- 1189.4%Service Call
- 534.2%False Alarm
- 483.8%Hazardous Condition
- 50.4%Severe Weather
- 30.2%Special Incident
- Fire incident types reported to NFIRS in Lone Jack, MO
- 15652.5%Structure Fires
- 10435.0%Outside Fires
- 268.8%Mobile Property/Vehicle Fires
- 113.7%Other
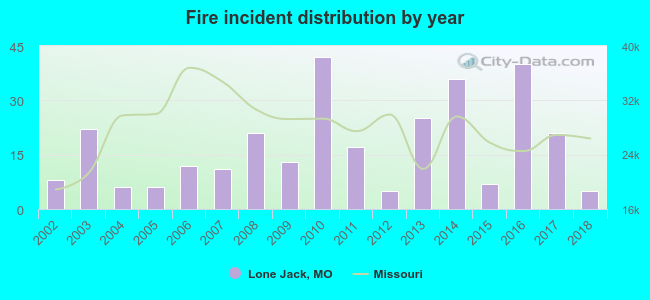 Based on the data from the years 2002 - 2018 the average number of fire incidents per year is 17. The highest number of fires - 42 took place in 2010, and the least - 5 in 2012. The data has a dropping trend.
 31.0% incidents where reported in the morning and 69.0% in the evening. The most fires (21.2%) took place on Saturday, and the least (10.4%) on Tuesday.
 According to the 297 fire incident reports from years 2002 - 2018 most fires (21.5%) took place during March, and the least (3.0%) in July.
 Out of all 1,262 cases reported during the years 2002 - 2018, the most belonged to the categories: Rescue & EMS (47.5%), Fire (23.5%), and Good Intent Call (10.9%).
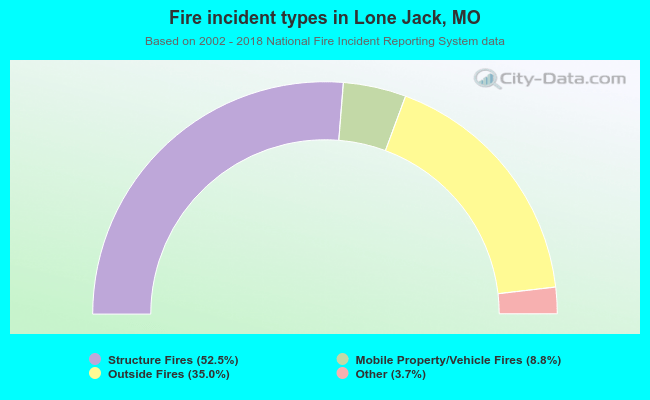 When looking into fire subcategories, the most reports belonged to: Structure Fires (52.5%), and Outside Fires (35.0%).