Long Beach: Fire Incidents, Washington (WA)
Where are fire incidents reported in Long Beach, WA
Something went wrong! Please refresh the page.
|
| |||||||||||||||||||||||||||||||||||||||||||||||||||||||||||||||||||||||||||||||||||||||||||||||||||||||||||||
2002 - 2018 National Fire Incident Reporting System (NFIRS) incidents
- Incident types reported to NFIRS in Long Beach, WA
- 70240.5%Rescue & EMS
- 40223.2%Fire
- 28716.6%Service Call
- 18610.7%Good Intent Call
- 895.1%False Alarm
- 573.3%Hazardous Condition
- 80.5%Special Incident
- 20.1%Overpressure Rupture
- Fire incident types reported to NFIRS in Long Beach, WA
- 18746.5%Structure Fires
- 14435.8%Outside Fires
- 4010.0%Mobile Property/Vehicle Fires
- 317.7%Other
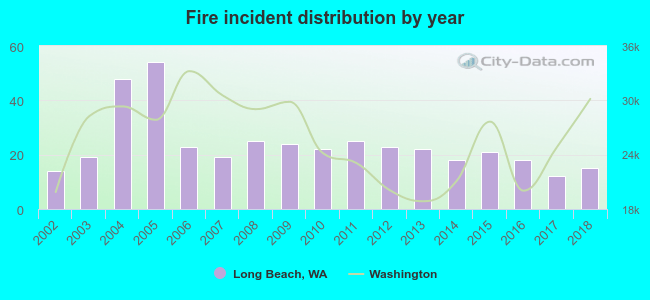 According to the data from the years 2002 - 2018 the average number of fire incidents per year is 24. The highest number of fire incidents - 54 took place in 2005, and the least - 12 in 2017. The data has an increasing trend.
 28.1% incidents where reported in the morning and 71.9% in the evening. The most fires (17.9%) took place on Sunday, and the least (11.2%) on Friday.
 Based on the 402 fire incidents from years 2002 - 2018 most fires (13.4%) took place during July, and the least (5.5%) in February.
 Out of all 1,733 cases reported during the years 2002 - 2018, the most belonged to the categories: Rescue & EMS (40.5%), Fire (23.2%), and Service Call (16.6%).
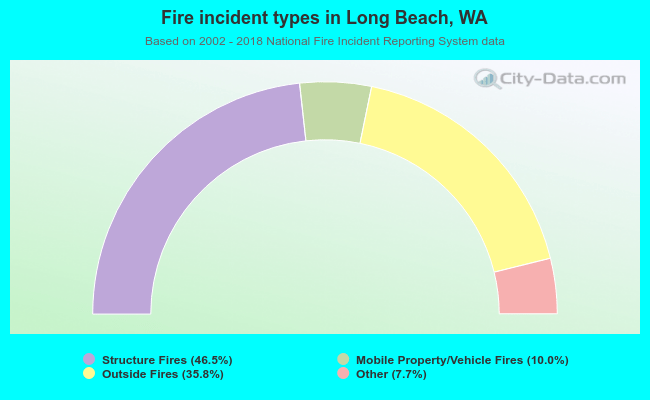 When looking into fire subcategories, the most incidents belonged to: Structure Fires (46.5%), and Outside Fires (35.8%).