| Fire incidents reported |
|---|
| Sreet name | Count |
|---|
| ROAD 29A | 14 | | US160 HIGHWAY | 10 | | 2833 HWY 160 | 8 | | 3000 CYCLONE | 8 | | DELAWARE | 8 | | 4TH | 6 | | ANTLER ROAD | 6 | | KANSAS | 6 | | RD 30 AND INDIGO | 6 | | ROAD 27 | 6 | | 268 RD 25 | 4 | | 29 AND GRAIN | 4 | | 6TH ST | 4 | | 702 DELAWARE | 4 | | 8TH ST. & OSAGE | 4 | | ANGUS ROAD | 4 | | FLINT | 4 | | FLINT ROAD | 4 | | INDIGO ROAD | 4 | | LIBERTY | 4 | | MONTGOMERY | 4 | | OXEN AND RD 21 | 4 | | ROAD 28 | 4 | | US 160 HWY | 4 | | 1 M | 2 |
| | | Fire incidents reported |
|---|
| Sreet name | Count |
|---|
| 1237 ROAD 27 RD | 2 | | 160 HWY AND RD 28 | 2 | | 1799 GRAIN | 2 | | 202 KANSAS | 2 | | 204 W FOURTH STREET | 2 | | 205 E FIFTH | 2 | | 2088 RD 27 | 2 | | 2090 EVERGREEN | 2 | | 212 N ELM | 2 | | 2131 HWY 160 ROAD | 2 | | 219 RD 29 A | 2 | | 2231 ANTLER | 2 | | 2231 ANTLER RD | 2 | | 2254 ANTLER RD | 2 | | 2288 EVERGREEN RD | 2 | | 2433 EXPLORER ROAD | 2 | | 2451 FLINT RD | 2 | | 248 RD 25 | 2 | | 248 ROAD 25 | 2 | | 2564 FLINT | 2 | | 2580 EVERGREEN | 2 | | 2703 HAWK RD | 2 | | 2851 LANE | 2 | | 2884 FLINT | 2 | | |
|
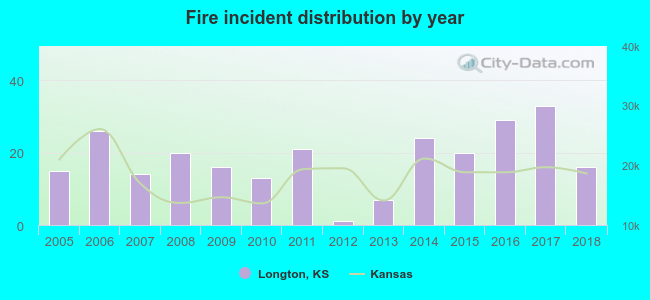 According to the data from the years 2005 - 2018 the average number of fires per year is 18. The highest number of fire incidents - 33 took place in 2017, and the least - 1 in 2012. The data has a growing trend.
 17.6% incidents where reported in the morning and 82.4% in the evening. The most fires (20.4%) took place on Tuesday, and the least (10.6%) on Sunday.
 Based on the 255 incident reports from years 2005 - 2018 most fires (30.2%) took place during March, and the least (3.1%) in August.
 Out of all 287 cases reported during the years 2005 - 2018, the most belonged to the categories: Fire (88.9%), Service Call (5.6%), and Rescue & EMS (2.8%).
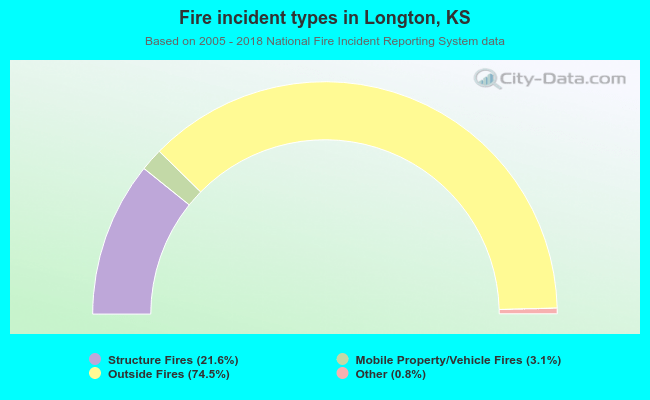 When looking into fire subcategories, the most reports belonged to: Outside Fires (74.5%), and Structure Fires (21.6%).