Loogootee: Fire Incidents, Indiana (IN)
Where are fire incidents reported in Loogootee, IN
Something went wrong! Please refresh the page.
|
| |||||||||||||||||||||||||||||||||||||||||||||||||||||||||||||||||||||||||||||||||||||||||||||||||||||||||||||
| Other | 134 | |||||||||||||||||||||||||||||||||||||||||||||||||||||||||||||||||||||||||||||||||||||||||||||||||||||||||||||
2002 - 2018 National Fire Incident Reporting System (NFIRS) incidents
- Incident types reported to NFIRS in Loogootee, IN
- 49050.7%Fire
- 21822.5%Rescue & EMS
- 13614.1%Hazardous Condition
- 495.1%Service Call
- 313.2%Special Incident
- 192.0%Good Intent Call
- 192.0%False Alarm
- 50.5%Overpressure Rupture
- Fire incident types reported to NFIRS in Loogootee, IN
- 22245.3%Structure Fires
- 18738.2%Outside Fires
- 5210.6%Mobile Property/Vehicle Fires
- 295.9%Other
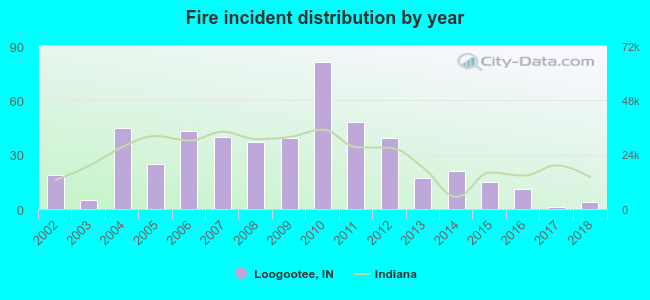 Based on the data from the years 2002 - 2018 the average number of fire incidents per year is 29. The highest number of reported fires - 81 took place in 2010, and the least - 1 in 2017. The data has a dropping trend.
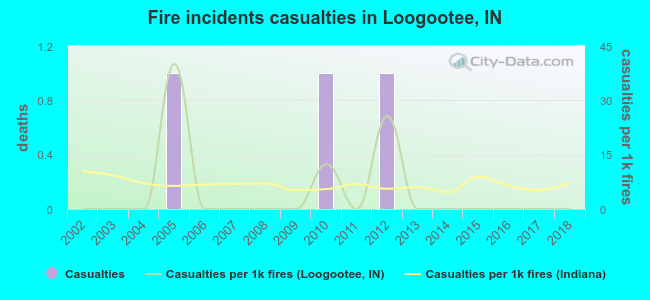 According to the data from the years 2002 - 2018 the average number of fire-related casualties per year is 0. The highest number of reported injuries - 1 took place in 2005, and the lowest - 0 in 2002. The data has a constant trend.
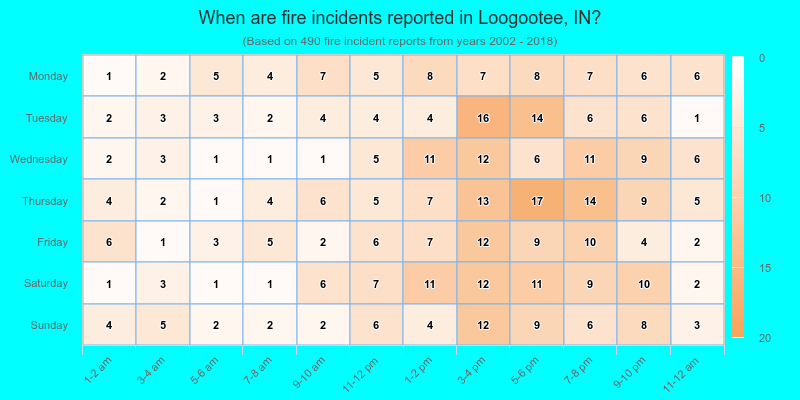
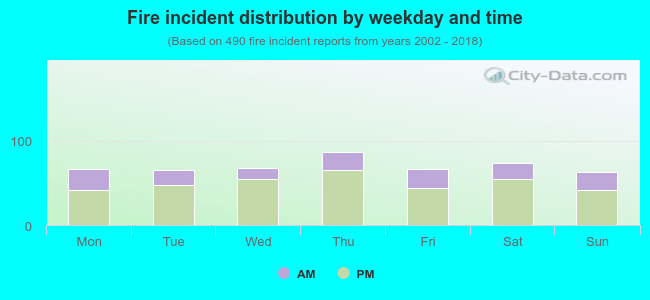 28.6% incidents where reported in the morning and 71.4% in the evening. The most fires (17.8%) took place on Thursday, and the least (12.9%) on Sunday.
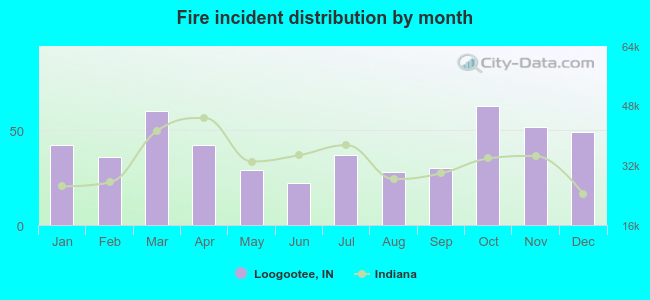 Based on the 490 incident reports from years 2002 - 2018 most fires (12.9%) took place during October, and the least (4.5%) in June.
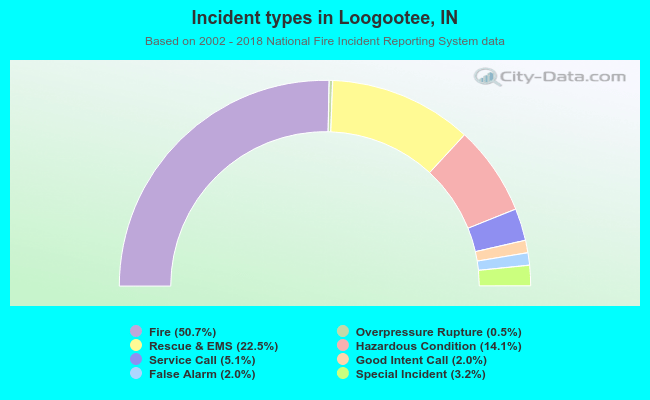 Out of all 967 cases reported during the years 2002 - 2018, the most belonged to the categories: Fire (50.7%), Rescue & EMS (22.5%), and Hazardous Condition (14.1%).
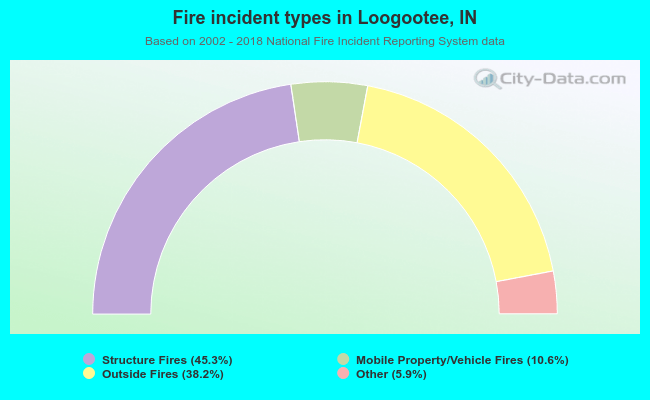 When looking into fire subcategories, the most incidents belonged to: Structure Fires (45.3%), and Outside Fires (38.2%).