Lorena: Fire Incidents, Texas (TX)
Where are fire incidents reported in Lorena, TX
Something went wrong! Please refresh the page.
|
| |||||||||||||||||||||||||||||||||||||||||||||||||||||||||||||||||||||||||||||||||||||||||||||||||||||||||||||
| Other | 1 | |||||||||||||||||||||||||||||||||||||||||||||||||||||||||||||||||||||||||||||||||||||||||||||||||||||||||||||
2002 - 2018 National Fire Incident Reporting System (NFIRS) incidents
- Incident types reported to NFIRS in Lorena, TX
- 38572.9%Fire
- 6111.6%Good Intent Call
- 346.4%Hazardous Condition
- 203.8%False Alarm
- 193.6%Rescue & EMS
- 91.7%Service Call
- Fire incident types reported to NFIRS in Lorena, TX
- 25365.7%Outside Fires
- 7118.4%Structure Fires
- 4511.7%Mobile Property/Vehicle Fires
- 164.2%Other
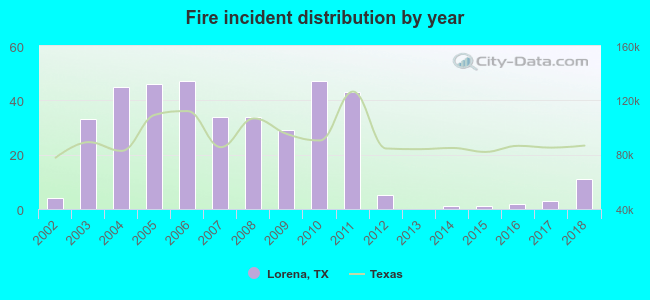 Based on the data from the years 2002 - 2018 the average number of fire incidents per year is 23. The highest number of fires - 47 took place in 2006, and the least - 0 in 2013. The data has a growing trend.
 20.3% incidents where reported in the morning and 79.7% in the evening. The most fires (15.8%) took place on Tuesday, and the least (12.7%) on Thursday.
 According to the 385 reports from years 2002 - 2018 most fires (14.0%) took place during July, and the least (3.9%) in April.
 Out of all 528 cases reported during the years 2002 - 2018, the most belonged to the categories: Fire (72.9%), Service Call (11.6%), and Rescue & EMS (6.4%).
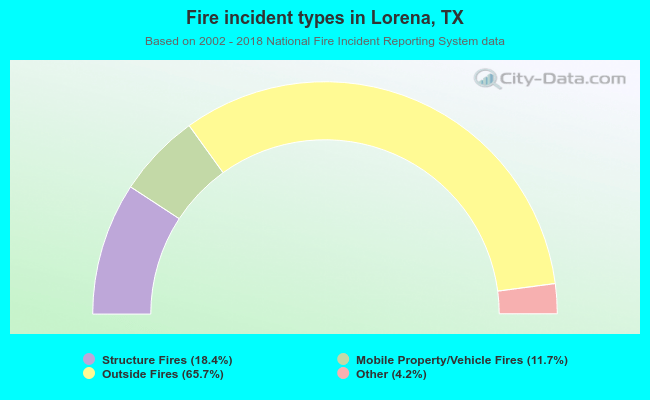 When looking into fire subcategories, the most reports belonged to: Outside Fires (65.7%), and Structure Fires (18.4%).