Loudonville: Fire Incidents, Ohio (OH)
Where are fire incidents reported in Loudonville, OH
Something went wrong! Please refresh the page.
|
| |||||||||||||||||||||||||||||||||||||||||||||||||||||||||||||||||||||||||||||||||||||||||||||||||||||||||||||
2002 - 2018 National Fire Incident Reporting System (NFIRS) incidents
- Incident types reported to NFIRS in Loudonville, OH
- 1,29454.4%Rescue & EMS
- 42617.9%Fire
- 24510.3%Hazardous Condition
- 2088.7%Service Call
- 1124.7%Good Intent Call
- 903.8%False Alarm
- Fire incident types reported to NFIRS in Loudonville, OH
- 20247.4%Structure Fires
- 14032.9%Outside Fires
- 7617.8%Mobile Property/Vehicle Fires
- 81.9%Other
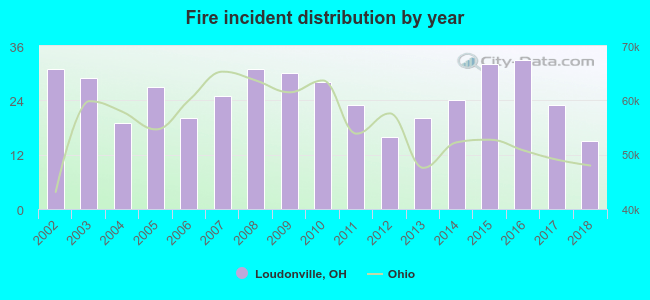 Based on the data from the years 2002 - 2018 the average number of fires per year is 25. The highest number of reported fires - 33 took place in 2016, and the least - 15 in 2018. The data has a decreasing trend.
 27.2% incidents where reported in the morning and 72.8% in the evening. The most fires (17.6%) took place on Friday, and the least (12.7%) on Tuesday.
 Based on the 426 fire incident reports from years 2002 - 2018 most fires (12.9%) took place during April, and the least (4.9%) in August.
 Out of all 2,379 cases reported during the years 2002 - 2018, the most belonged to the categories: Rescue & EMS (54.4%), Fire (17.9%), and Hazardous Condition (10.3%).
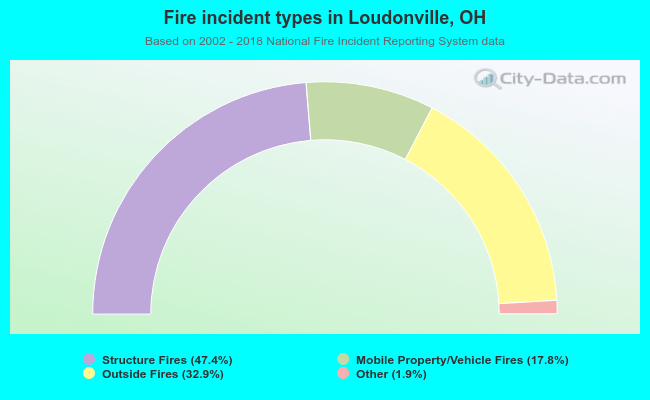 When looking into fire subcategories, the most reports belonged to: Structure Fires (47.4%), and Outside Fires (32.9%).