| Fire incidents reported |
|---|
| Sreet name | Count |
|---|
| WOOD ST | 72 | | OAK STREET EXTENSION | 36 | | MCCARTNEY ROAD | 30 | | KENNEDY RD | 26 | | MCCARTNEY RD | 26 | | BEDFORD RD | 22 | | COITSVILLE HUBBARD ROAD | 22 | | HUBBARD RD | 22 | | MCGAFFNEY ST | 16 | | WALNUT ST | 16 | | NEW CASTLE RD | 14 | | NEW CASTLE RD. RD | 14 | | NORTH HUBBARD ROAD | 14 | | STRUTHERS RD | 14 | | WATER ST | 14 | | YOUNGSTOWN LOWELLVILLE RD | 14 | | JOHNSON ROAD | 12 | | SOUTH HUBBARD ROAD | 12 | | BEDFORD ROAD | 10 | | MCGUFFEY ROAD | 10 | | UPLAND | 10 | | UPLAND RD | 10 | | VILLA MARIE RD | 10 | | COIT RD | 8 | | COOPER ST | 8 |
| | | Fire incidents reported |
|---|
| Sreet name | Count |
|---|
| HIGH ST | 8 | | HUBBARD | 8 | | OAK ST | 8 | | QUARRY RD | 8 | | ROCKET PL | 8 | | COITSVILLE HUBBARD RD | 6 | | GRANT ST | 6 | | JUMP DRIVE | 6 | | LIBERTY ST | 6 | | MCGILL ST | 6 | | MCGUFFEY RD | 6 | | MILLIGAN RD | 6 | | QUEISNER AVE | 6 | | ROCKET PLACE | 6 | | STATE LINE ROAD | 6 | | STRUTHERS COITSVILLE ROAD | 6 | | WATSON AVE | 6 | | ARREL-SMITH ROAD | 4 | | CENTER RD | 4 | | CENTER ROAD | 4 | | COITSVILLE STRUTHERS ROAD | 4 | | COOPER RD | 4 | | GUADALUPE | 4 | | HUBBARD RD RD | 4 | | |
|
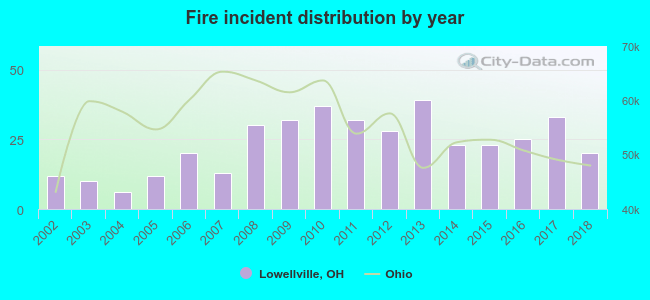 According to the data from the years 2002 - 2018 the average number of fires per year is 23. The highest number of reported fires - 39 took place in 2013, and the least - 6 in 2004. The data has a rising trend.
 28.1% incidents where reported in the morning and 71.9% in the evening. The most fires (16.7%) took place on Tuesday, and the least (12.7%) on Thursday.
 According to the 395 incident reports from years 2002 - 2018 most fires (14.4%) took place during March, and the least (5.1%) in October.
 Out of all 1,417 cases reported during the years 2002 - 2018, the most belonged to the categories: Service Call (34.2%), Fire (27.9%), and Rescue & EMS (12.8%).
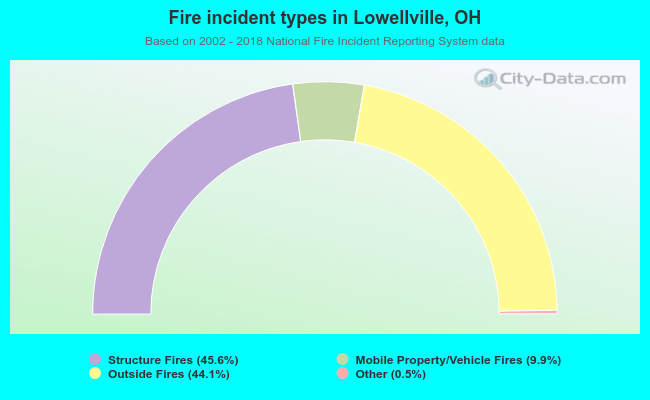 When looking into fire subcategories, the most incidents belonged to: Structure Fires (45.6%), and Outside Fires (44.1%).