Lowville: Fire Incidents, New York (NY)
Where are fire incidents reported in Lowville, NY
Something went wrong! Please refresh the page.
|
| |||||||||||||||||||||||||||||||||||||||||||||||||||||||||||||||||||||||||||||||||||||||||||||||||||||||||||||
2003 - 2018 National Fire Incident Reporting System (NFIRS) incidents
- Incident types reported to NFIRS in Lowville, NY
- 87745.0%Hazardous Condition
- 46323.7%Fire
- 21911.2%False Alarm
- 1276.5%Rescue & EMS
- 894.6%Special Incident
- 763.9%Service Call
- 683.5%Good Intent Call
- 291.5%Severe Weather
- 20.1%Overpressure Rupture
- Fire incident types reported to NFIRS in Lowville, NY
- 23350.3%Structure Fires
- 12627.2%Outside Fires
- 6614.3%Mobile Property/Vehicle Fires
- 388.2%Other
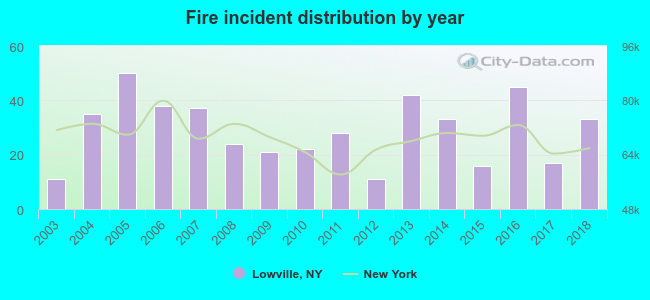 According to the data from the years 2003 - 2018 the average number of fires per year is 29. The highest number of reported fire incidents - 50 took place in 2005, and the least - 11 in 2003. The data has a growing trend.
 According to the data from the years 2003 - 2018 the average number of fire-related casualties per year is 0. The highest number of casualties - 3 took place in 2011, and the lowest - 0 in 2003. The data has a constant trend.
 30.0% incidents where reported in the morning and 70.0% in the evening. The most fires (15.8%) took place on Tuesday, and the least (12.1%) on Sunday.
 According to the 463 reports from years 2003 - 2018 most fires (15.1%) took place during April, and the least (4.5%) in August.
 Out of all 1,950 cases reported during the years 2003 - 2018, the most belonged to the categories: Hazardous Condition (45.0%), Fire (23.7%), and False Alarm (11.2%).
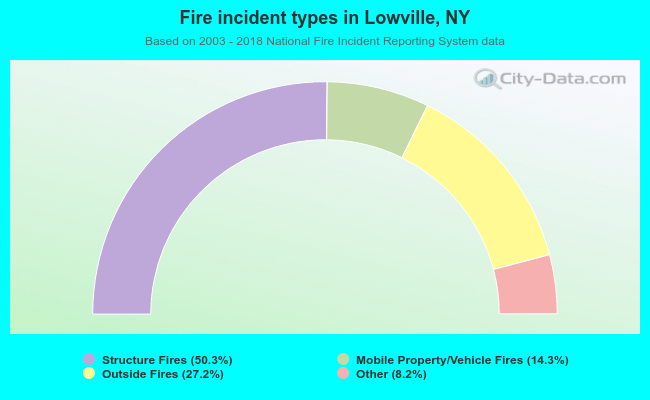 When looking into fire subcategories, the most reports belonged to: Structure Fires (50.3%), and Outside Fires (27.2%).