| Fire incidents reported |
|---|
| Sreet name | Count |
|---|
| INDUSTRIAL BLVD | 40 | | ST PAUL CHURCH RD | 12 | | BELLS FERRY RD | 10 | | CEDAR PARK RD | 10 | | MAIN ST | 10 | | BIG HORSE CREEK RD | 8 | | HIGHWAY 19 | 8 | | HIGHWAY 19 S | 8 | | RIVER RD | 8 | | RR 1 | 8 | | VIRGINIA ST | 8 | | BELL FERRY RD | 6 | | ERIE ST | 6 | | HIGHWAY 117 | 6 | | HIGHWAY 341 | 6 | | JOHNSON ST | 6 | | MCLEAN RD | 6 | | TOM HALEY RD | 6 | | CHURCH ST | 4 | | FISHING CREEK RD | 4 | | GA HWY 19 | 4 | | HWY 341 | 4 | | JOHN ST | 4 | | JOHNNY COURSON RD | 4 | | JOHNNY COURSEN RD | 4 |
| | | Fire incidents reported |
|---|
| Sreet name | Count |
|---|
| MAIN ST | 4 | | MT CALVARY CHURCH RD | 4 | | RED OAK DR | 4 | | S HIGHWAY 19 | 4 | | SANDPIT RD | 4 | | WASHINGTON ST | 4 | | 101 WEST IND ROAD | 2 | | 103 VIRGINIA AVE | 2 | | 1056 SAND PIT RD | 2 | | 106 N HIGHWAY 19 | 2 | | 1065 MATHIS ROAD | 2 | | 1095 BELLS FERRY RD | 2 | | 117 HWY | 2 | | 1260 ST PAUL RD | 2 | | 171 MILL CREEK LN | 2 | | 2616 HWY 341 | 2 | | 341 NORTH LUMBERCITY | 2 | | 344 INDUSTRIAL BLVD | 2 | | 86 JOHNNY COURSON RD | 2 | | BOYD ST | 2 | | BROWN ST | 2 | | CALHOUN ST | 2 | | CENTRAL AV | 2 | | CHANEY ST ST | 2 | | |
|
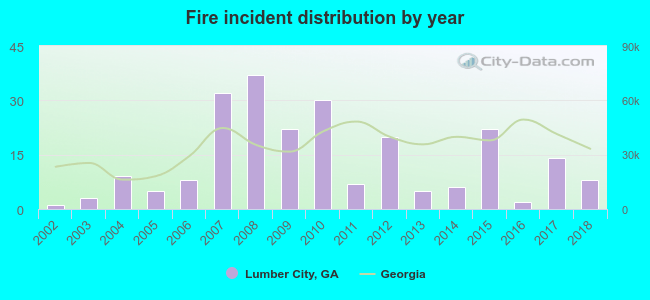 Based on the data from the years 2002 - 2018 the average number of fires per year is 14. The highest number of fires - 37 took place in 2008, and the least - 1 in 2002. The data has a rising trend.
 34.6% incidents where reported in the morning and 65.4% in the evening. The most fires (17.7%) took place on Monday, and the least (10.4%) on Sunday.
 According to the 231 incident reports from years 2002 - 2018 most fires (16.9%) took place during January, and the least (3.0%) in December.
 Out of all 291 cases reported during the years 2002 - 2018, the most belonged to the categories: Fire (79.4%), Rescue & EMS (10.3%), and Overpressure Rupture (6.9%).
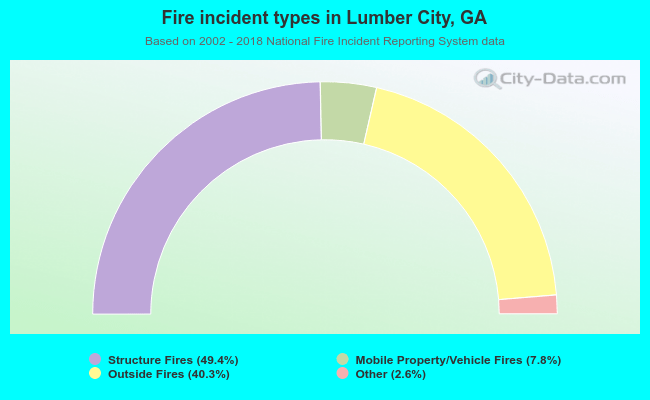 When looking into fire subcategories, the most reports belonged to: Structure Fires (49.4%), and Outside Fires (40.3%).