| Fire incidents reported |
|---|
| Sreet name | Count |
|---|
| LIONEL WASHINGTON ST | 24 | | COURSEAULT AVE | 20 | | MAIN ST | 16 | | CENTRAL AVE | 14 | | KING AVE | 14 | | LOUISIANA AVE | 8 | | LUTCHER AVE | 8 | | LEVY GAUDET | 6 | | 2ND ST | 4 | | ALBERT ST | 4 | | CABANOSE AVE | 4 | | CYPRESS ST | 4 | | EXCHANGE | 4 | | LA 44 HWY | 4 | | LAWRENCE ST | 4 | | LEBRAY ST | 4 | | RAILROAD AVE | 4 | | ST. LOUIS | 4 | | 12142 DEY SAY ST. | 2 | | 1840 THIRD ST. | 2 | | 1882 DALE STREET | 2 | | 2207 ALEXANDER ST. | 2 | | 2208 ALEXANDER ST. | 2 | | 2208 MILES STREET | 2 | | 2329 LIONEL WASHINGTON | 2 |
| | | Fire incidents reported |
|---|
| Sreet name | Count |
|---|
| 2355 N. ALBERT ST. | 2 | | 2367 LIONEL WASHINGTON | 2 | | 2374 WEST LEBRAY STREET | 2 | | 2466 LIONEL WASHINGTON ST | 2 | | 2634 NORTH KING AVE APT-C | 2 | | 2675 COURSEAULT ST. | 2 | | 2686 BROOKS APTS APT D | 2 | | 3RD ST | 2 | | ALEXANDER ST | 2 | | BEHIND VERON'S STORE | 2 | | BROOKS APT | 2 | | CORSEAULT ST | 2 | | CORUSEAULT AVE | 2 | | COURSEAULT | 2 | | COURSEAULT ST | 2 | | DELOGNY CT | 2 | | DEY SAY ST | 2 | | EAST LEBRAY STREET | 2 | | FAUSTINE CT | 2 | | GEORGE ST | 2 | | KING AVENUE/FIFTH ST. | 2 | | LA 3125 HWY | 2 | | LA 3193 / LA 3125 | 2 | | LEVY GAUDET ST | 2 | | |
|
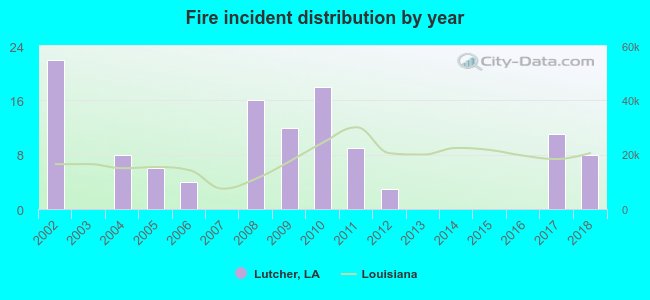 Based on the data from the years 2002 - 2018 the average number of fires per year is 7. The highest number of reported fire incidents - 22 took place in 2002, and the least - 0 in 2003. The data has a decreasing trend.
 35.9% incidents where reported in the morning and 64.1% in the evening. The most fires (22.2%) took place on Saturday, and the least (10.3%) on Wednesday.
 According to the 117 incident reports from years 2002 - 2018 most fires (12.0%) took place during January, and the least (5.1%) in May.
 Out of all 214 cases reported during the years 2002 - 2018, the most belonged to the categories: Fire (54.7%), Good Intent Call (18.7%), and Rescue & EMS (10.3%).
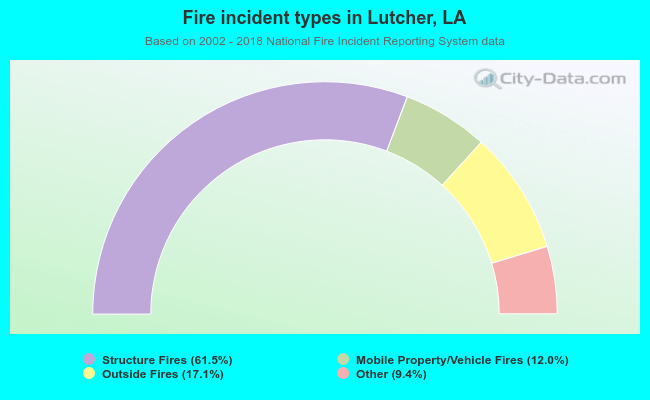 When looking into fire subcategories, the most incidents belonged to: Structure Fires (61.5%), and Outside Fires (17.1%).