| Fire incidents reported |
|---|
| Sreet name | Count |
|---|
| FOREST AVE | 59 | | FOURTH ST | 45 | | THIRD ST | 45 | | PETREY HWY | 30 | | WOODFORD AVE | 23 | | LIVE OAK RD | 20 | | CARTER RD | 15 | | CENTER RIDGE RD | 15 | | GLENWOOD AVE | 15 | | MONTGOMERY HWY | 15 | | NINTH ST | 15 | | RUTLEDGE LOOP RD | 15 | | DARIEN CHURCH RD | 10 | | ELLIS DR | 10 | | MCGOUGH RD | 10 | | MT IDA RD | 10 | | MT IDA RD | 10 | | RICHBURG RD | 10 | | RIDGECREST DR | 10 | | RUTLEDGE ST | 10 | | SIXTH ST | 10 | | TROY HWY | 10 | | TURKEY CREEK RD | 10 | | US 29 HWY | 10 | | WYROSDICK RD | 10 |
| | | Fire incidents reported |
|---|
| Sreet name | Count |
|---|
| FIFTH ST | 9 | | HAWKINS AVE | 9 | | JEFFCOAT ST | 9 | | ROY BEALL DR | 9 | | BROOKWOOD APT115 DR | 5 | | 1055 TATER CREEK RD | 5 | | 2ND STREET | 5 | | 4198 MONTGOMERY HWY. | 5 | | 4370 MONTGOMERY HWY | 5 | | AIRPORT RD | 5 | | ATHENS CHURCH RD | 5 | | BEE CREEK RD | 5 | | BLACK ROCK ROAD | 5 | | BROOKWOOD AVE | 5 | | BROOKWOOD DR | 5 | | CAMPGROUND CHURCH RD | 5 | | CHOWELL PARTS HWY. 331 | 5 | | CO RD 1171 | 5 | | COUNTY 1172 RD | 5 | | CRENSHAW COUNTY LAKE RD | 5 | | CURTIS ST | 5 | | DARIEN CHURCH RD | 5 | | DARIEN CHURCH HWY | 5 | | FERRENE RD | 5 | | FINLAY ST | 5 |
|
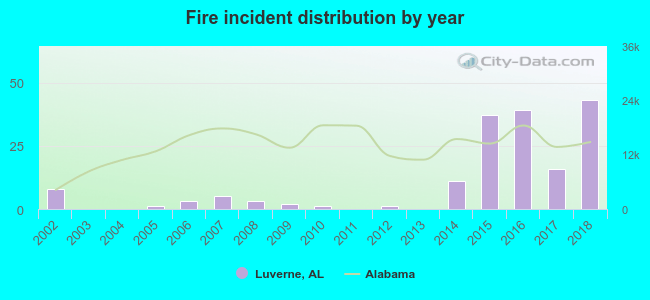 According to the data from the years 2002 - 2018 the average number of fire incidents per year is 10. The highest number of reported fires - 43 took place in 2018, and the least - 0 in 2003. The data has an increasing trend.
 28.8% incidents where reported in the morning and 71.2% in the evening. The most fires (19.4%) took place on Tuesday, and the least (8.8%) on Sunday.
 Based on the 170 reports from years 2002 - 2018 most fires (13.5%) took place during January, and the least (4.7%) in April.
 Out of all 628 cases reported during the years 2002 - 2018, the most belonged to the categories: Overpressure Rupture (31.4%), Fire (27.1%), and Hazardous Condition (17.2%).
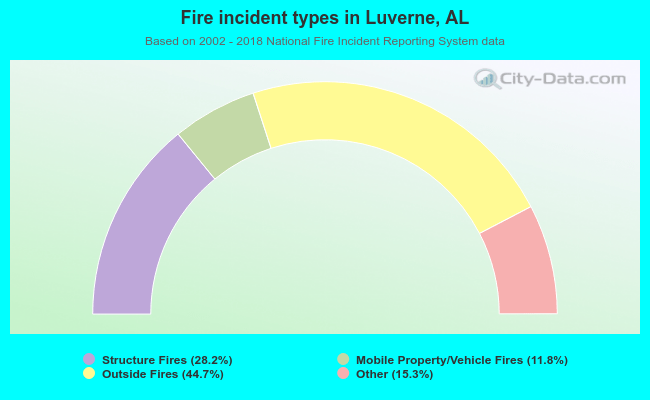 When looking into fire subcategories, the most reports belonged to: Outside Fires (44.7%), and Structure Fires (28.2%).