| Fire incidents reported |
|---|
| Sreet name | Count |
|---|
| 302 BROADWAY | 8 | | CANAL | 6 | | S MAIN | 6 | | 215 CHRISCO | 4 | | 2534 E S H 120 | 4 | | 27 TRAILER CITY RD | 4 | | 2897 E ST HWY 120 | 4 | | 306 SOUTH MAIN | 4 | | 309 CENTRAL | 4 | | 316 CHRISCO | 4 | | 3587 ESH 120 | 4 | | 4420 ECR 570 | 4 | | 4630 ECR 570 | 4 | | 514 BROADWAY | 4 | | 525 POWELL | 4 | | 685 NCR 599 | 4 | | 808 S RIVERDALE | 4 | | 813 RIVERDALE | 4 | | CALHOUN ST | 4 | | E C R 506 | 4 | | ESH 158 I55 | 4 | | HANNA RD | 4 | | HWY 61 | 4 | | HWY 61 ECR 602 | 4 | | HWY 61 NORTH OF LUXORA | 4 |
| | | Fire incidents reported |
|---|
| Sreet name | Count |
|---|
| HWY 61 SOUTH OF HWY 158 | 4 | | I 55 @ 53 MM / NB SIDE | 4 | | I 55 NB 54MM | 4 | | I55 53MM | 4 | | I55 NB 55MM | 4 | | TRAILER CITY RD | 4 | | 101 S MAIN | 2 | | 104 ADAMS | 2 | | 110 ADAMS ST | 2 | | 111 N MAPLE | 2 | | 113 WASHINGTON | 2 | | 119 CANAL | 2 | | 119 EAST CALHOUN | 2 | | 120 WALNUT | 2 | | 1309 NCR 759 | 2 | | 158 BROADWAY ST | 2 | | 1610 S WOODLAWN | 2 | | 1673 E C R 602 | 2 | | 1673 ECR 602 | 2 | | 1695 ECR 506 | 2 | | 17 JOSEPH WARREN | 2 | | 200 S MAIN | 2 | | 202 CALHOUN ST | 2 | | 202 DEBBIE | 2 | | 202 E CALHOUN | 2 |
|
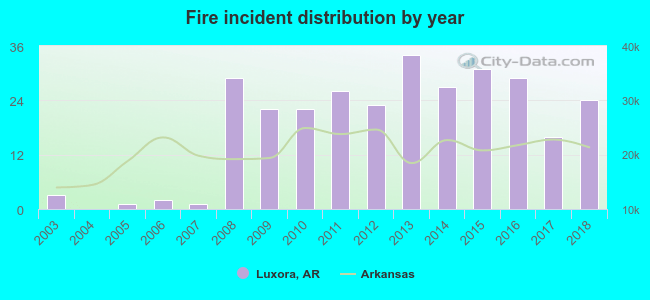 According to the data from the years 2003 - 2018 the average number of fires per year is 18. The highest number of reported fire incidents - 34 took place in 2013, and the least - 0 in 2004. The data has a growing trend.
 37.2% incidents where reported in the morning and 62.8% in the evening. The most fires (18.6%) took place on Tuesday, and the least (10.3%) on Friday.
 Based on the 290 fire incident reports from years 2003 - 2018 most fires (12.1%) took place during July, and the least (4.5%) in February.
 Out of all 698 cases reported during the years 2003 - 2018, the most belonged to the categories: Rescue & EMS (52.4%), Fire (41.5%), and Good Intent Call (4.4%).
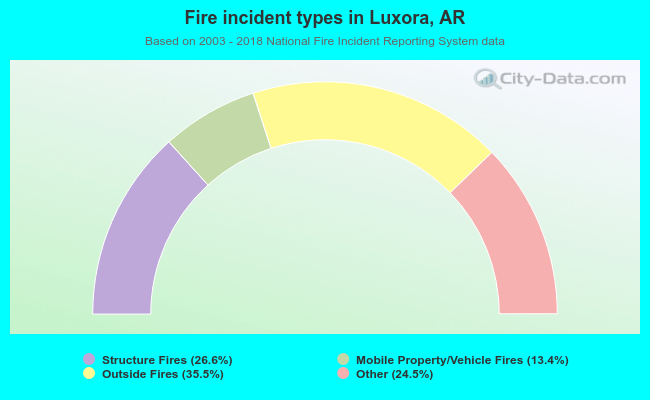 When looking into fire subcategories, the most reports belonged to: Outside Fires (35.5%), and Structure Fires (26.6%).