| Fire incidents reported |
|---|
| Sreet name | Count |
|---|
| 114 HWY | 34 | | GA. 114 HWY | 24 | | HWY 114 HWY | 16 | | 100 HWY | 14 | | GAYLOR RD | 12 | | CHATTOOGA AVE | 10 | | JOSH WARD RD | 10 | | OAK HILL RD | 10 | | STARLING MILL RD | 10 | | HAMMOND ST | 8 | | LYELY DAM RD | 8 | | SLING ALLEY RD | 8 | | BACK VALLEY RD | 6 | | DOGWOOD DR | 6 | | HAMP BREWER CIR | 6 | | JOSH WARD RD RD | 6 | | LICK SKILLET RD | 6 | | OWENS DAIRY RD | 6 | | WEEMS RD | 6 | | ALPINE ST | 4 | | BACK VALLEY RD RD | 4 | | BALL FIELD RD | 4 | | DOGWOOD CIR | 4 | | DOVERS CUT RD RD | 4 | | EVANS RD | 4 |
| | | Fire incidents reported |
|---|
| Sreet name | Count |
|---|
| FOSTER (LYERLY) ST | 4 | | HIGHWAY 100 HWY | 4 | | HOLLANDCHATTOOGAVILLE RD | 4 | | HUMMINGBIRD CIR | 4 | | HWY 100 | 4 | | HWY 100 HWY | 4 | | HWY 114 | 4 | | JOHNSON CEMETARY RD RD | 4 | | LM THOMAS JR RD | 4 | | LYERLY DAM | 4 | | LYERLY DAM RD RD | 4 | | MCDANIEL RD | 4 | | OAK HILL RD RD | 4 | | RACCOON CREEK RD | 4 | | RACCOON CREEK RD | 4 | | RAGLAND RD | 4 | | TALIFERRO SPRINGS RD | 4 | | #8 CHATTOOGA AVE. ST | 2 | | 1675 LICK SKILLET RD RD | 2 | | 1682 LYERLY DAM RD RD | 2 | | 3065 HOLLAND CHATTOOGAVILLE RD RD | 2 | | 5366 HWY 114 HWY | 2 | | 596 BROOKS RD RD | 2 | | 6776 HWY 114 HWY | 2 | | |
|
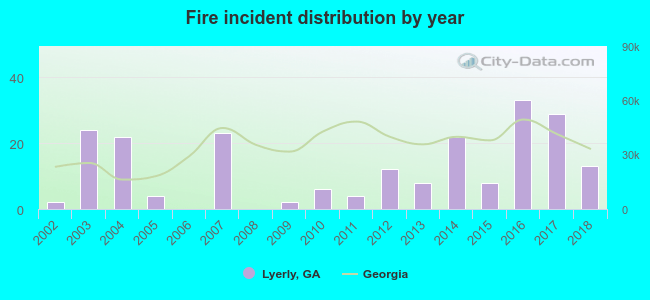 Based on the data from the years 2002 - 2018 the average number of fires per year is 12. The highest number of fires - 33 took place in 2016, and the least - 0 in 2006. The data has a rising trend.
 29.7% incidents where reported in the morning and 70.3% in the evening. The most fires (21.2%) took place on Saturday, and the least (9.4%) on Wednesday.
 According to the 212 incident reports from years 2002 - 2018 most fires (21.2%) took place during March, and the least (4.2%) in June.
 Out of all 654 cases reported during the years 2002 - 2018, the most belonged to the categories: Overpressure Rupture (34.9%), Fire (32.4%), and Service Call (15.4%).
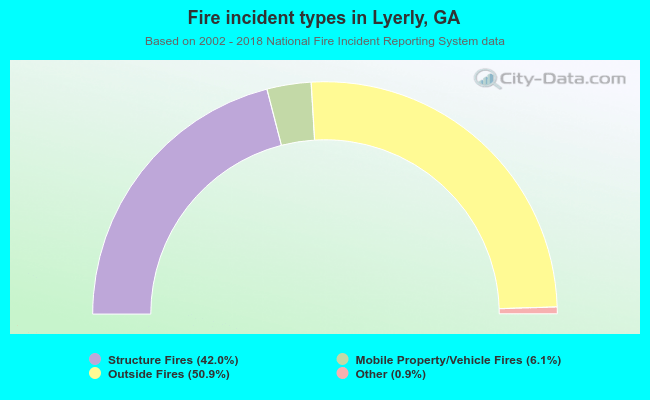 When looking into fire subcategories, the most reports belonged to: Outside Fires (50.9%), and Structure Fires (42.0%).