Lyford: Fire Incidents, Texas (TX)
Where are fire incidents reported in Lyford, TX
Something went wrong! Please refresh the page.
|
| |||||||||||||||||||||||||||||||||||||||||||||||||||||||||||||||||||||||||||||||||||||||||||||||||||||||||||||
2002 - 2017 National Fire Incident Reporting System (NFIRS) incidents
- Incident types reported to NFIRS in Lyford, TX
- 20373.3%Fire
- 3010.8%Hazardous Condition
- 217.6%Service Call
- 124.3%Rescue & EMS
- 62.2%Good Intent Call
- 20.7%Overpressure Rupture
- 10.4%False Alarm
- 10.4%Severe Weather
- 10.4%Special Incident
- Fire incident types reported to NFIRS in Lyford, TX
- 11757.6%Outside Fires
- 3416.7%Structure Fires
- 3416.7%Mobile Property/Vehicle Fires
- 188.9%Other
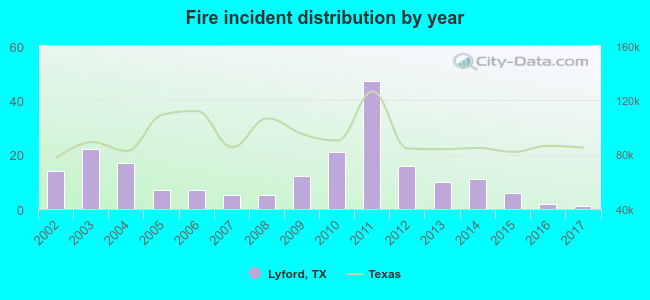 Based on the data from the years 2002 - 2017 the average number of fire incidents per year is 13. The highest number of fire incidents - 47 took place in 2011, and the least - 1 in 2017. The data has a dropping trend.
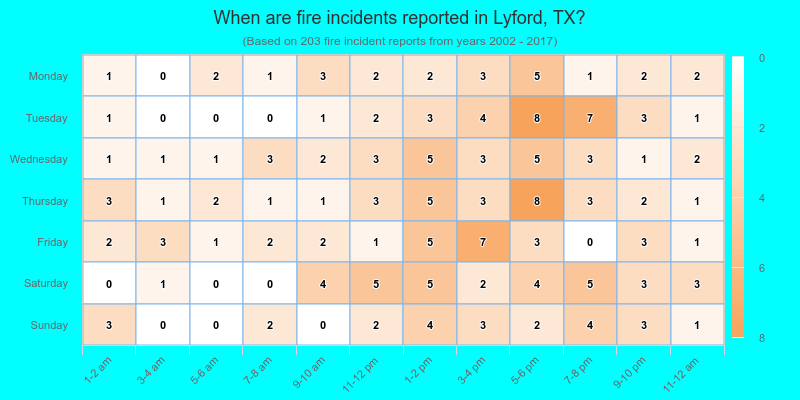
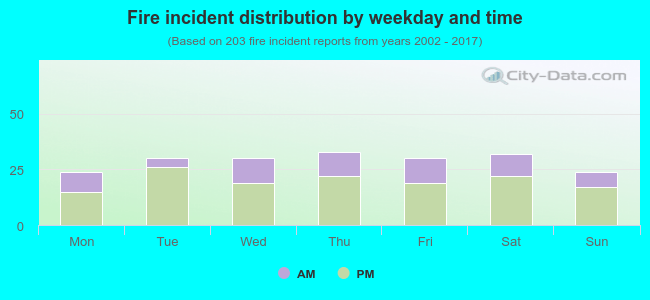 31.0% incidents where reported in the morning and 69.0% in the evening. The most fires (16.3%) took place on Thursday, and the least (11.8%) on Monday.
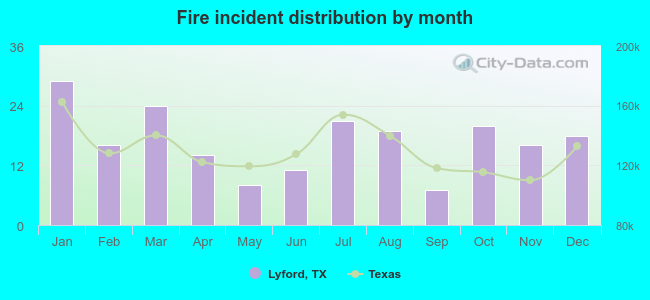 Based on the 203 fires from years 2002 - 2017 most fires (14.3%) took place during January, and the least (3.4%) in September.
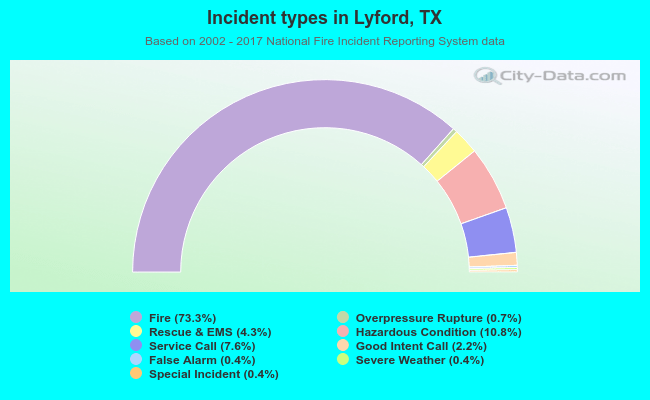 Out of all 277 cases reported during the years 2002 - 2017, the most belonged to the categories: Fire (73.3%), Hazardous Condition (10.8%), and Service Call (7.6%).
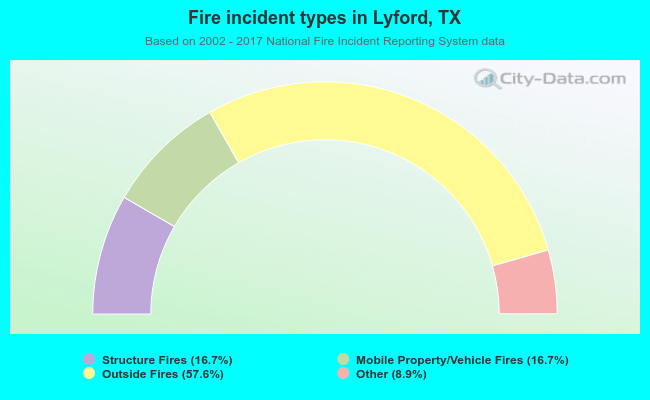 When looking into fire subcategories, the most incidents belonged to: Outside Fires (57.6%), and Structure Fires (16.7%).