| Fire incidents reported |
|---|
| Sreet name | Count |
|---|
| HWY 14 | 40 | | CENTERVILLE HWY | 32 | | SR 14 | 18 | | CENTERVILLE HWY | 16 | | CANYON RD | 14 | | OLD HWY 8 | 14 | | MOTT RD | 12 | | SCHILLING RD | 10 | | HIGHWAY 14 | 8 | | HWY 142 | 8 | | HWY 142 MP 5 | 8 | | JOHNSON AVE | 8 | | LYLE POINT | 8 | | 7TH STREET | 6 | | COURTNEY RD | 6 | | HARTLAND RD | 6 | | HIGHWAY 14 HWY | 6 | | HWY 142 MP 1 | 6 | | KLICKITAT ST | 6 | | LYLE-SNOWDEN RD | 6 | | MP 74.5 HWY 14 | 6 | | MP 80 HWY 14 | 6 | | OLD HIGHWAY 8 | 6 | | PITMAN RD | 6 | | WASHINGTON ST | 6 |
| | | Fire incidents reported |
|---|
| Sreet name | Count |
|---|
| 6TH STREET | 4 | | BALCH RD | 4 | | BALCH ROAD | 4 | | CANYON ROAD | 4 | | COURTNEY ROAD | 4 | | COVE RD | 4 | | COVE RD. | 4 | | FISHER HILL RD | 4 | | HIGH PRAIRIE RD | 4 | | HIGHWAY 8 | 4 | | HWY 14 MP 78 | 4 | | HWY 142 MP 5.5 | 4 | | HY 14 HWY | 4 | | INLIEU SITE | 4 | | JOHNSON RD | 4 | | JOHNSON RD | 4 | | LYLE POINT PT | 4 | | LYLE POINT RD | 4 | | MAJOR CREEK | 4 | | MCCLAIN TUTHILL RD. | 4 | | MCGOWEN RD | 4 | | OLD HIGHWAY 8 HWY | 4 | | SCHILLING ROAD | 4 | | SCHILLING ROAD RD | 4 | | |
|
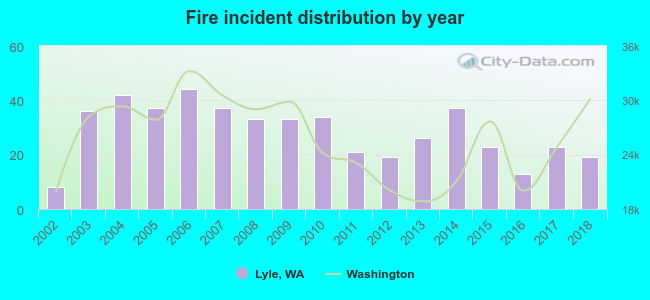 According to the data from the years 2002 - 2018 the average number of fire incidents per year is 29. The highest number of reported fires - 44 took place in 2006, and the least - 8 in 2002. The data has a rising trend.
 33.6% incidents where reported in the morning and 66.4% in the evening. The most fires (17.9%) took place on Sunday, and the least (12.0%) on Thursday.
 According to the 485 fire incidents from years 2002 - 2018 most fires (28.5%) took place during July, and the least (1.0%) in January.
 Out of all 1,118 cases reported during the years 2002 - 2018, the most belonged to the categories: Fire (43.4%), Overpressure Rupture (39.7%), and Service Call (7.2%).
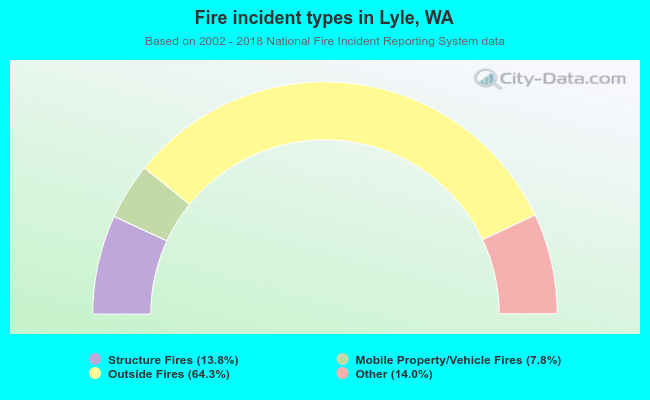 When looking into fire subcategories, the most reports belonged to: Outside Fires (64.3%), and Other (14.0%).