| Fire incidents reported |
|---|
| Sreet name | Count |
|---|
| FOREST RD | 20 | | PURGATORY FALLS RD | 20 | | OLD TEMPLE RD | 18 | | MOUNTAIN RD | 16 | | FOREST RD | 14 | | CENTER RD | 12 | | CENTER RD | 10 | | JOHNSON CORNER RD | 8 | | PETTINGILL HILL RD | 8 | | CIDER MILL RD | 6 | | GLASS FACTORY RD | 6 | | JOHNSON CORNER RD | 6 | | OLD TEMPLE RD | 6 | | PUTNAM HILL RD | 6 | | PUTNAM HILL RD | 6 | | AVALON RD | 4 | | BROMAN WAY | 4 | | CENTER 1025-1716 RD | 4 | | COLLINS RD | 4 | | FOREST RDRTE 31 | 4 | | JOHNSON CORNERS RD | 4 | | MOUNTAIN RD | 4 | | PERHAM CORNER RD | 4 | | PURGATORY FALLS RD | 4 | | 17 BRANDY BROOK LN | 2 |
| | | Fire incidents reported |
|---|
| Sreet name | Count |
|---|
| 2ND NEW HAMPSHIRE TPKE | 2 | | AVALON DR | 2 | | AVALON RD | 2 | | BALDWIN HILL RD | 2 | | BALDWIN HILL RD | 2 | | BRANDY BROOK RD | 2 | | BRAUMAN WAY | 2 | | BROMEN RD | 2 | | BULLARD DR | 2 | | CEMETERY 1-304 RD | 2 | | CENTER 1-1024 RD | 2 | | CENTER ROAD | 2 | | CRAM HILL131-311 RD | 2 | | CROKED S RD | 2 | | CROOKED S RD | 2 | | DUTTON RD | 2 | | FAY RD | 2 | | FITZBERG | 2 | | FORREST RD | 2 | | FREDETTE DR | 2 | | GLASS FACTORY ROAD | 2 | | GROVE RD | 2 | | HILLSIDE DRIVE | 2 | | HOLT ROAD | 2 | | |
|
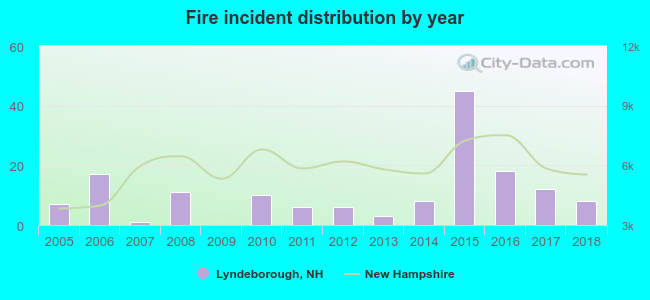 According to the data from the years 2005 - 2018 the average number of fires per year is 11. The highest number of fire incidents - 45 took place in 2015, and the least - 0 in 2009. The data has a rising trend.
 33.6% incidents where reported in the morning and 66.4% in the evening. The most fires (21.7%) took place on Tuesday, and the least (5.3%) on Wednesday.
 According to the 152 incident reports from years 2005 - 2018 most fires (17.8%) took place during February, and the least (0.7%) in November.
 Out of all 656 cases reported during the years 2005 - 2018, the most belonged to the categories: Rescue & EMS (45.0%), Fire (23.2%), and Good Intent Call (9.6%).
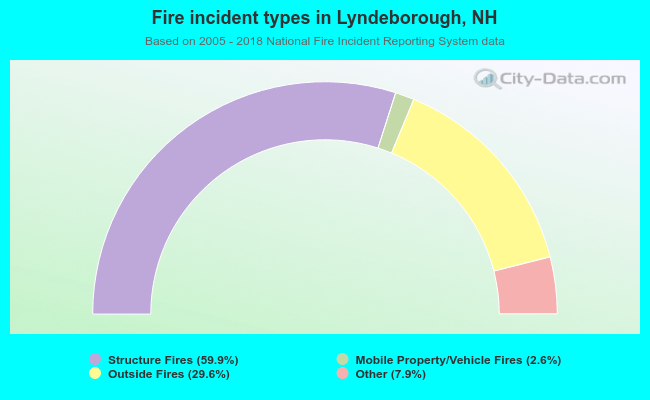 When looking into fire subcategories, the most incidents belonged to: Structure Fires (59.9%), and Outside Fires (29.6%).