| Fire incidents reported |
|---|
| Sreet name | Count |
|---|
| MOUNT TORREY RD | 240 | | COMMONWEALTH DR | 30 | | LYNDHURST RD | 28 | | HOWARDSVILLE TPKE | 26 | | COX HOLLOW LN | 22 | | REEDS GAP RD | 18 | | WINTERVIEW LN | 18 | | BACK CREEK LN | 16 | | HOWARDSVILLE TPKE | 16 | | MT TORREY RD | 16 | | BLACKWELL LN | 14 | | COUNTY AUGUSTA | 14 | | KINGSWOOD CT | 14 | | INCH RUN LN | 10 | | LOVE RD | 10 | | RAMSEYS FARM LN | 10 | | RISING SUN LN | 10 | | SHERANDO LAKE RD | 10 | | STONEYRIDGE LN | 10 | | VEL-MAR LN | 10 | | COAL ROAD | 8 | | INCH ROBINSON LN | 8 | | LYNDHURST ROAD | 8 | | SIGNAL LN | 8 | | CHINQUAPIN DR | 6 |
| | | Fire incidents reported |
|---|
| Sreet name | Count |
|---|
| COAL RD | 6 | | CREEK RD | 6 | | CREEKSIDE CIR | 6 | | DEERWOOD LN | 6 | | MEADOW LN | 6 | | MT TORREY ROAD | 6 | | ROBINSON HOLLOW | 6 | | WINDY ACRES LN | 6 | | BEAR PATH | 4 | | BLUE RIDGE PKY | 4 | | BRENT DR | 4 | | CREEKSIDE DR | 4 | | DUSTY OAK LN | 4 | | FEATHERSTONE DR | 4 | | HIBERNIA CIR | 4 | | HOWARDSVILLE TURN | 4 | | INCH RUN LANE | 4 | | MOUNT TORREY ROAD | 4 | | MT. TORREY RD | 4 | | PATTERSON LN | 4 | | SHERANDO DUMPSTER SITE | 4 | | THOMAS DR | 4 | | TRACTOR LN | 4 | | 127 RISING SUN LN | 2 | | |
|
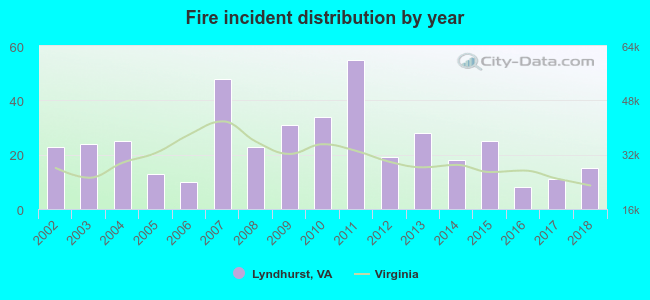 According to the data from the years 2002 - 2018 the average number of fires per year is 24. The highest number of fires - 55 took place in 2011, and the least - 8 in 2016. The data has a declining trend.
 35.9% incidents where reported in the morning and 64.1% in the evening. The most fires (18.3%) took place on Saturday, and the least (8.3%) on Wednesday.
 According to the 410 reports from years 2002 - 2018 most fires (15.6%) took place during January, and the least (1.2%) in September.
 Out of all 1,363 cases reported during the years 2002 - 2018, the most belonged to the categories: Fire (30.1%), Hazardous Condition (26.2%), and Good Intent Call (18.0%).
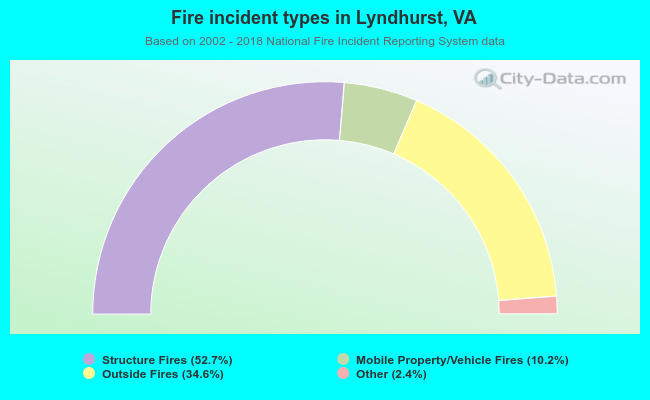 When looking into fire subcategories, the most incidents belonged to: Structure Fires (52.7%), and Outside Fires (34.6%).